
Figures & data
Table 1. Variation explained by the first and second principal components for each factor.
Table 2A. Unit root test results for global factor.
Table 2B. Unit root test results for sectoral indices.
Figure 1. Reponses of Malaysian stock market to one-standard deviation of different global shocks. The confidence bands are based on a 95% significance level and constructed from Monte Carlo simulations based on 2,500 replications.
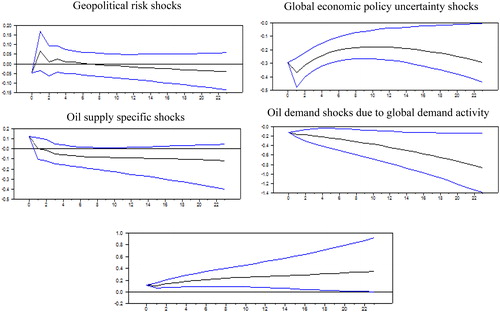
Table 3. Variance decomposition of global factor.
Table 4. Variance decomposition of stock market prices due to structural factors.
Figure 2. Sectoral responses to one-standard deviation of geopolitical risk shocks. The confidence bands are based on a 95% significance level and constructed from Monte Carlo simulations based on 2,500 replications.
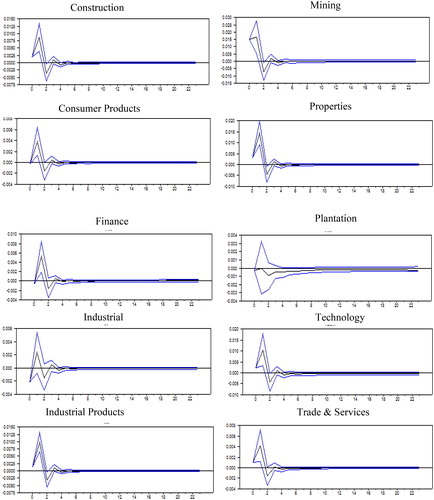
Figure 3. Sectoral responses to one-standard deviation of global economic policy uncertainty shocks. The confidence bands are based on a 95% significance level and constructed from Monte Carlo simulations based on 2,500 replications.
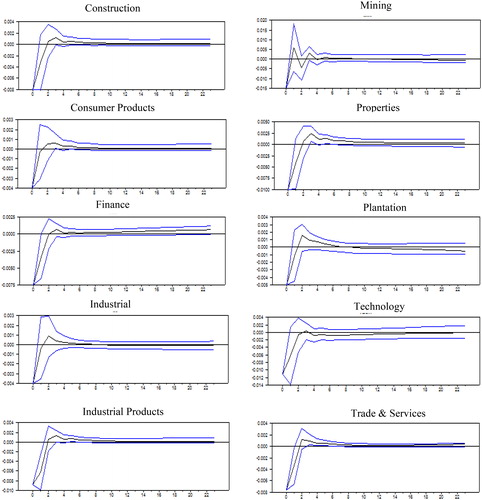
Figure 4. Sectoral responses to one-standard deviation of oil supply specific shocks. The confidence bands are based on a 95% significance level and constructed from Monte Carlo simulations based on 2,500 replications.
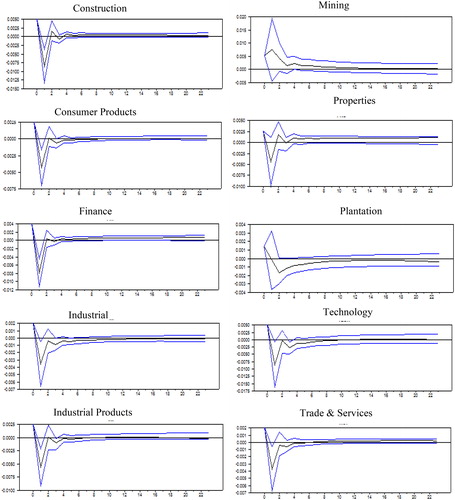
Figure 5. Sectoral responses to one-standard deviation of oil demand shocks due to global economic activity. The confidence bands are based on a 95% significance level and constructed from Monte Carlo simulations based on 2,500 replications.
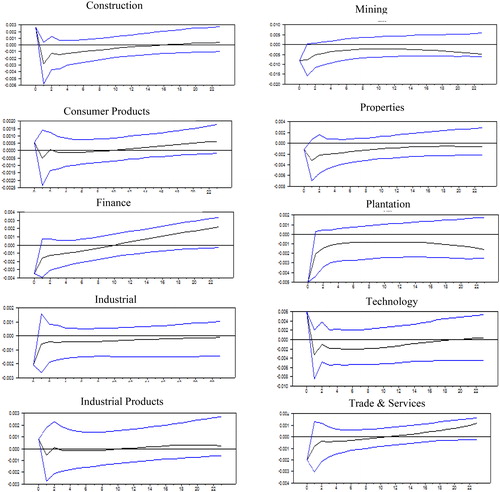
Figure 6. Sectoral responses to oil demand specific shocks. The confidence bands are based on a 95% significance level and constructed from Monte Carlo simulations based on 2,500 replications.
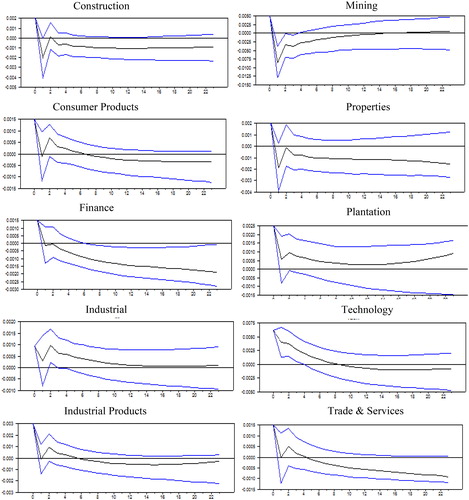
Table 5. Variance decomposition of sectoral stock prices due to shocks in global factor.
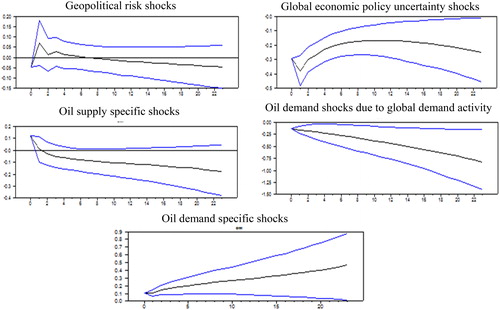
Figure 7: Reponses of Malaysian stock market price to one-standard deviation of different global shocks with different lag (7 lags). The confidence bands are based on a 95% significance level and constructed from Monte Carlo simulations based on 2,500 replications.
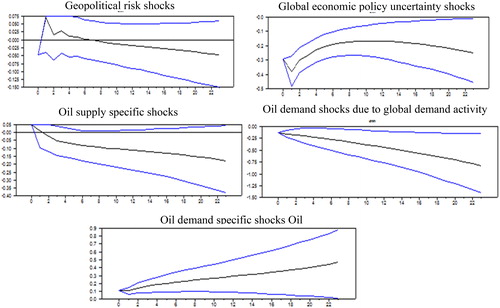
Figure 8. Reponses of Malaysian stock market price to one-standard deviation of different global shocks with recursive identification. The confidence bands are based on a 95% significance level and constructed from Monte Carlo simulations based on 2,500 replications.
Appendix A1. Variable description
Appendix A2. Description of data series.