
Figures & data
Table 1. Variables used in the analysis of the macroeconomic determinants of the interdependence between the C.E.E. markets and Western European capital markets.
Table 2. Descriptive statistics of the variables used in the analysis.
Table 3. Correlation matrix.
Figure 1. Results of wavelet coherence analysis Germany vs C.E.E. countries. Note: Contours with black represent a 5% significance estimated on the basis of Monte Carlo simulations with random surrogate series. The colours used to represent the wavelet range from blue (low power) to red (high power). Scale-Y indicates the frequency range from the shortest (four days) to the longest (1,024 days). Scale-X is the analysis period in years. Black vertical lines are key moments in adopting codes of governance in C.E.E. countries. The relationship between two variables indicated by the direction of the arrows is as follows: (1) If the arrow indicates the direction to the right, the indices are synchronised; (2) the first index leads if the arrow points to the upper right; (3) the first index is behind if the arrow indicates the right direction down; (4) the indexes are out of sync (exerting anti-cyclic effects between them) if the arrow points to the left; (5) desynchronised and the first index leads if the arrow points to the left and top; and (6) De-synchronised and the first index leads if the arrow indicates the left-most direction. Source: Author’s estimates.
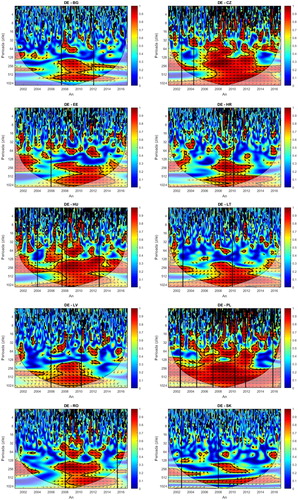
Figure 2. Results of the wavelet coherence analysis U.K. vs C.E.E. countries. Source: Author’s estimates.
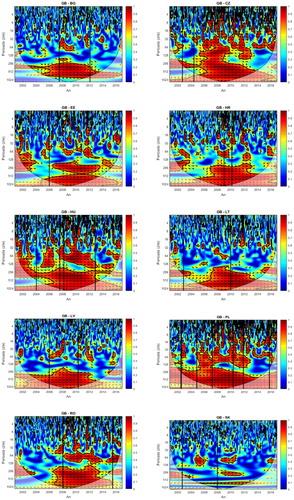
Table 4. Results from panel unit root testing.
Table 5. Results from panel data cointegration tests.
Table 6. Results from the A.R.D.L. panel model estimation.