
Figures & data
Table 1. Overview of the selected previous studies which analyse financial integration in CEE and SEE.
Figure 1. Stock indices during the year 2009 and 2015.
Source: DataStream.
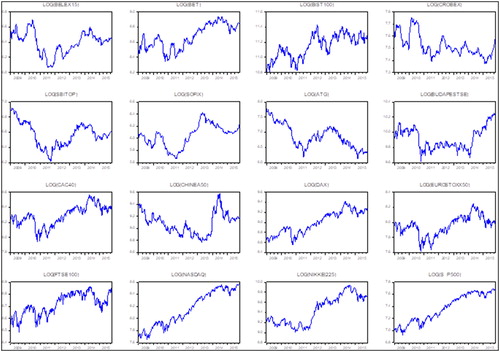
Figure 2. Returns of stock prices indices.
Source: DataStream, returns on stocks are calculated by authors.
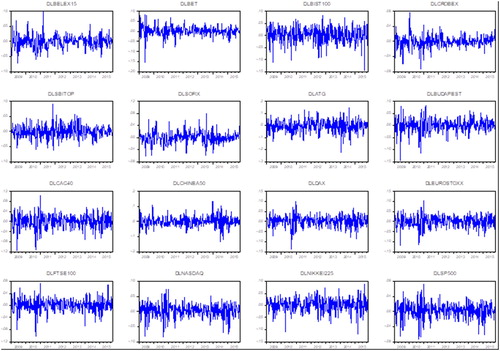
Table 2. Descriptive statistics of stock returns.
Table 3. Unconditional correlations.
Table 4. The results of returns and volatility spillover tests-Serbia.
Table 5. The results of return and volatility spillover tests-Romania.
Table 6. The results of return and volatility spillover tests-Turkey.
Table 7. The results of return and volatility spillover tests-Croatia.
Table 8. The results of return and volatility spillover tests-Slovenia.
Table 9. The results of return and volatility spillover tests-Bulgaria.