
Figures & data
Figure 1. Current account balance of payments as a percentage of GDP, by country.
Source: IMF (World Economic Outlook, April 2018): own calculations.
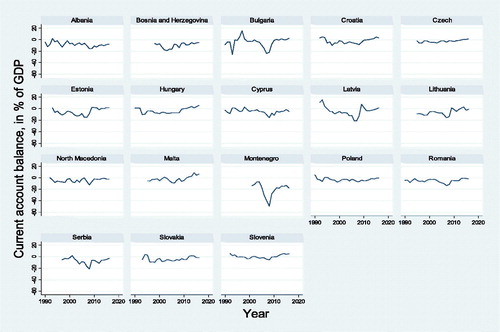
Figure 2. Real effective exchange rate index (2007 = 100), by country.
Source: http://bruegel.org/publications/datasets/real-effective-exchange-rates-for-178-countries-a-new-database; own calculations.
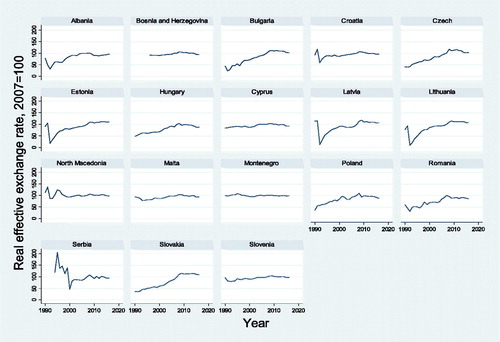
Table 1. Results of FGLS estimation, five model specifications (dependent variable is current account balance of payments as a percentage of GDP).
Figure 3. Dynamics in the effective exchange rate and trade deficit expressed as a percentage of GDP, in the countries using their own currency during the crisis.
Source: IMF; http://bruegel.org/publications/datasets/real-effective-exchange-rates-for-178-countries-a-new-database; own calculations.
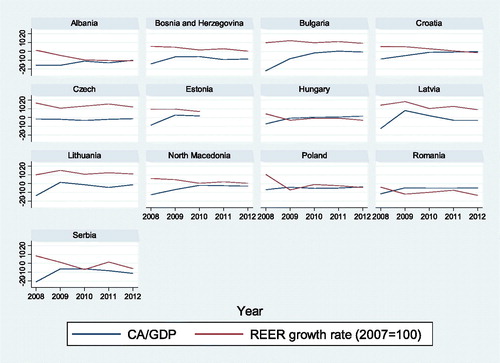
Figure 4. Dynamics in the real exchange rate and trade deficit expressed as a percentage of GDP, in the countries using the Euro during the crisis.
Source: IMF; http://bruegel.org/publications/datasets/real-effective-exchange-rates-for-178-countries-a-new-database; own calculations.
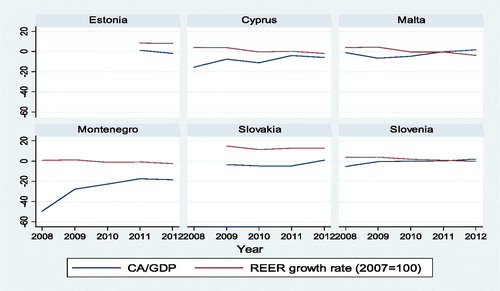
Table A1. Description of variables and their descriptive statistics.
Table A2. Current account balance of payments as a percentage of GDP for both the EU new member states and the Western Balkan countries, by year.
Table A3. Correlation matrix.
Table A4. Country uses its own currency, whole period.
Table A5. Country uses its own currency, period after 2000.
Table A6. Country uses its own currency, crisis period.
Table A7. Country uses the Euro, whole period.
Table A8. Country uses the Euro, crisis period.