Figures & data
Figure 1. The trends of BCP and GP.
Source: Authors' calculations.
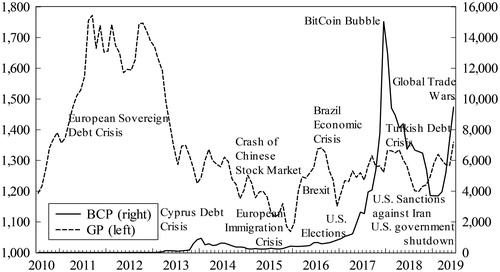
Table 1. Descriptive statistics for BCP, GP and USDX.
Table 2. The results of unit root test.
Table 3. Full-sample Granger causality tests.
Table 4. The results of parameter stability test.
Figure 2. Bootstrap p-values of rolling test statistic testing the null hypothesis that BCP does not Granger cause GP.
Source: Authors' calculations.
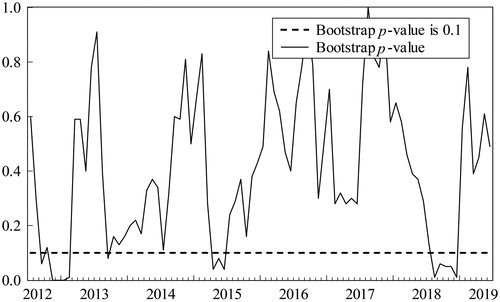
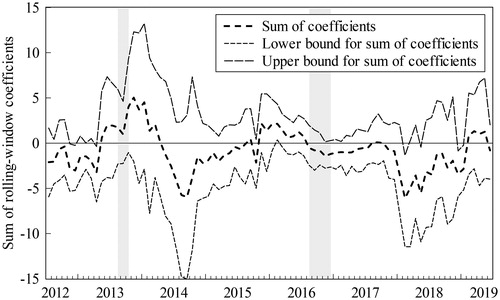
Figure 3. Bootstrap estimates of the sum of the rolling-window coefficients for the impact of BCP on GP.
Source: Authors' calculations.
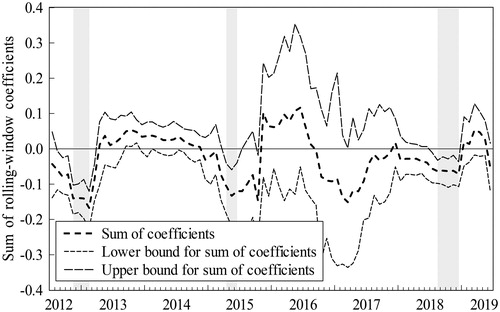
Figure 4. Bootstrap p-values of rolling test statistic testing the null hypothesis that GP does not Granger cause BCP.
Source: Authors' calculations.
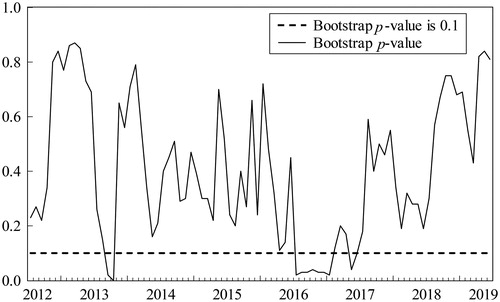
Figure 5. Bootstrap estimates of the sum of the rolling-window coefficients for the impact of GP on BCP.
Source: Authors' calculations.