Figures & data
Figure 1. Citation tree rings.
(Note: Citation tree rings represent the citation history of an article. The color of a citation ring denotes the time of corresponding citations. The thickness of a ring is proportional to the number of citations in a given time slice. The small number next to the center of a node is the citations throughout the entire time interval.)
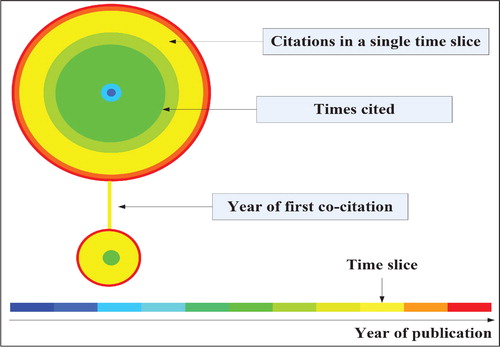
Figure 2. Betweenness centrality and burst detection.
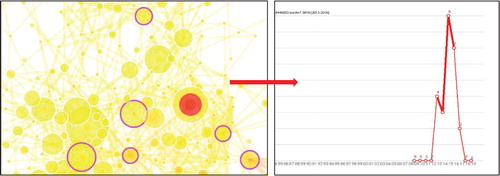
Figure 3. Data collection and analysis process.
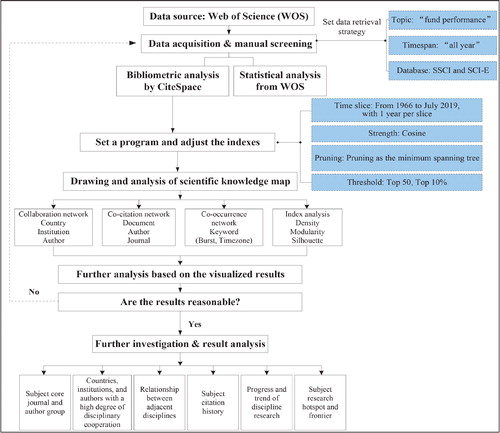
Figure 4. The number of publications and citations on fund performance research (1994–2019).
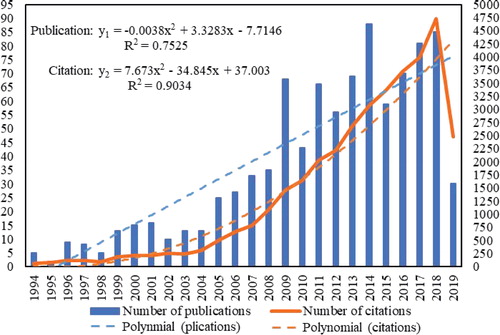
Figure 5. Document types on fund performance research (1966–2019).
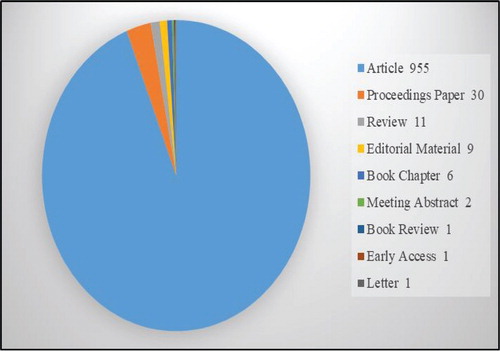
Table 1. The top 10 subject categories on fund performance research.
Table 2. The top 10 most productive journals on fund performance research.
Table 3. The top 10 most productive countries/regions on fund performance research.
Table 4. The top 10 most productive institutions on fund performance research.
Table 5. The top 10 most productive authors on fund performance research.
Figure 6. A visualization of the country collaboration network on fund performance research.
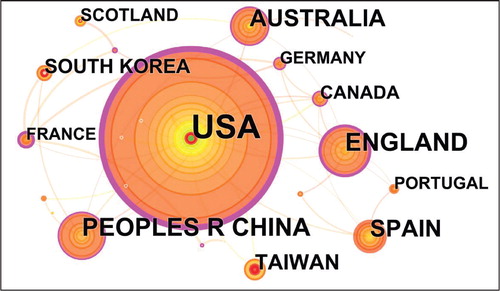
Table 6. The top 10 countries/regions based on frequency in collaboration network.
Figure 7. A visualization of the institution collaboration network on fund performance research.
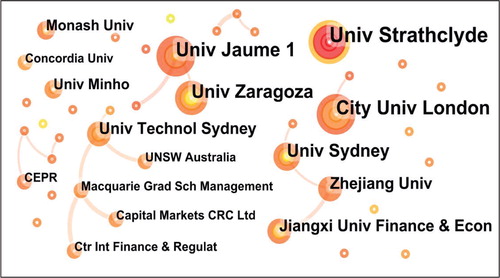
Table 7. The top 10 institutions based on frequency in collaboration network.
Figure 8. A visualization of the author collaboration network on fund performance research.
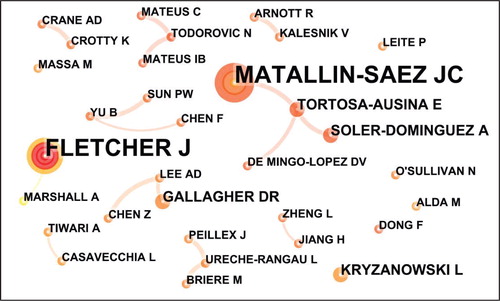
Table 8. The top 10 authors based on frequency on fund performance research.
Figure 9. A visualization of the document co-citation network on fund performance research.
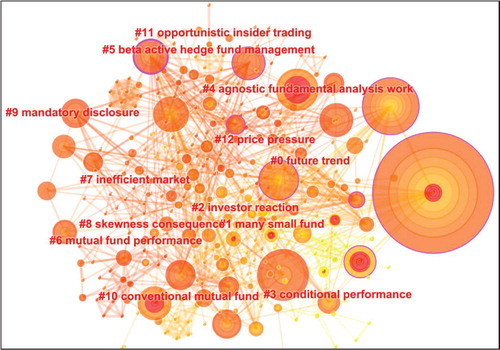
Table 9. Summary of the 13 clusters on fund performance research.
Table 10. The top 10 most cited papers with co-citation frequency on fund performance research.
Table 11. Highly cited publications on fund performance.
Table 12. The specific analysis of highly cited papers.
Figure 10. A visualization of the author co-citation network on fund performance research.
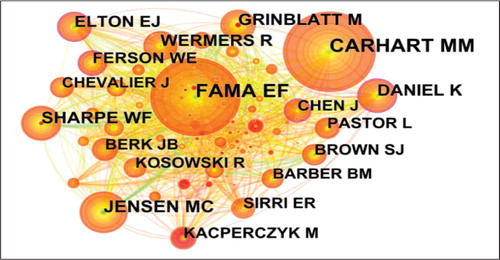
Table 13. The top 10 most cited authors with co-citation frequency on fund performance research.
Figure 11. A visualization of the journal co-citation network on fund performance research.
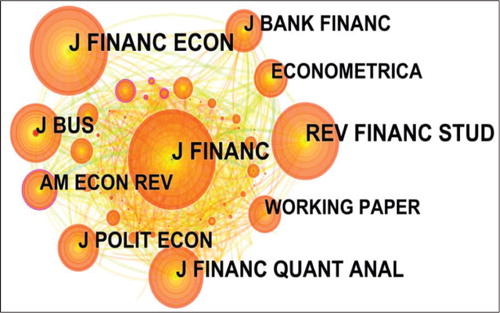
Table 14. The top 9 most cited journals with co-citation frequency on fund performance research.
Table 15. The top 8 references with the strongest citation bursts on fund performance research.
Table 16. The top 5 keywords with the strongest bursts on fund performance research.
Table 17. High cited articles corresponding to high frequency keywords.
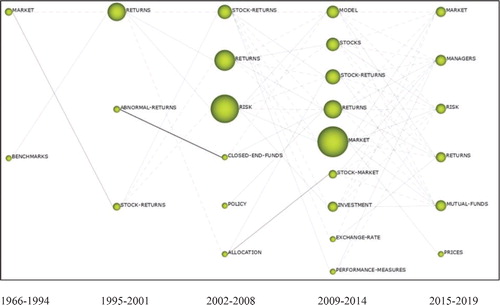
Figure 12. Timezone view of keywords on fund performance research.
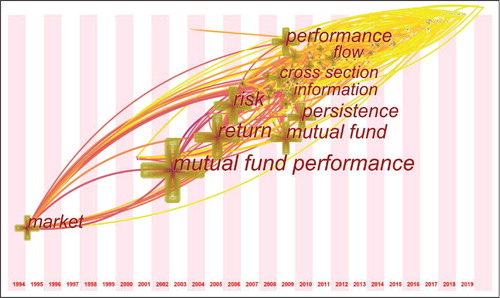
Table 18. The most frequently used keywords on fund performance research.
Figure 13. Fund performance theme evolution map.