Figures & data
Table 1. Descriptive statistics for BPR, FDI inflows and outflows.
Figure 1. Trend of BPR, FDI inflows and outflows.
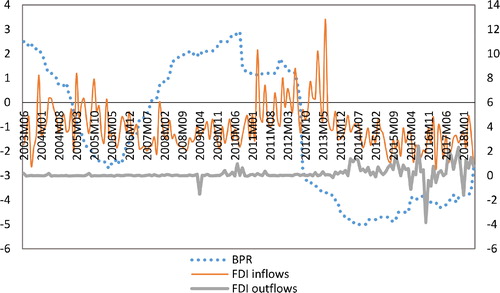
Table 2. Unit root test results.
Table 3. Full-sample Granger causality tests.
Table 4. Parameter stability tests.
Figure 2. Bootstrap p-value of rolling test statistic testing the null that FDI inflows do not Granger cause BPR.
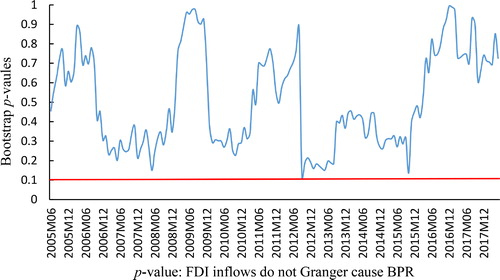
Figure 3. Bootstrap p-value of rolling test statistic testing the null that FDI outflows do not Granger cause BPR.
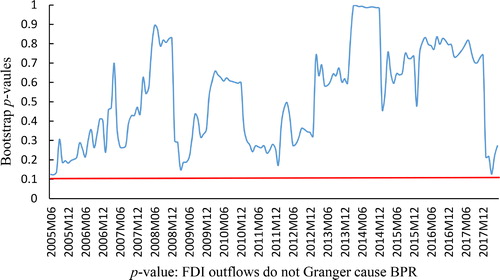
Figure 4. Bootstrap p-value of rolling test statistic testing the null that BPR do not Granger cause FDI inflows.
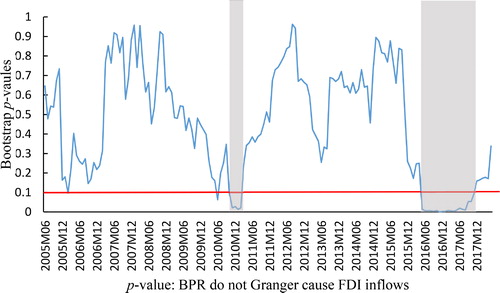
Figure 5. Bootstrap estimates of the sum of the rolling window coefficients for the impact of BPR on FDI inflows.
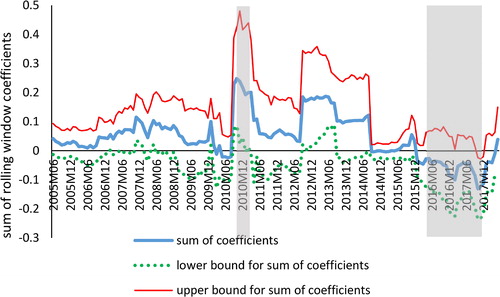
Figure 6. Bootstrap p-value of rolling test statistic testing the null that BPR do not Granger cause FDI outflows.
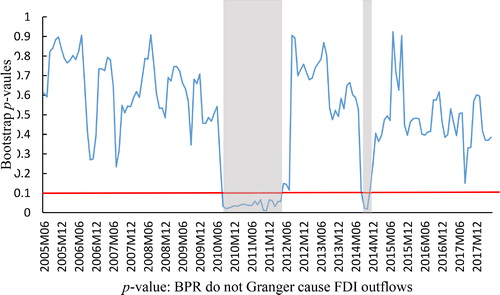
Figure 7. Bootstrap estimates of the sum of the rolling window coefficients for the impact of BPR on FDI outflows.
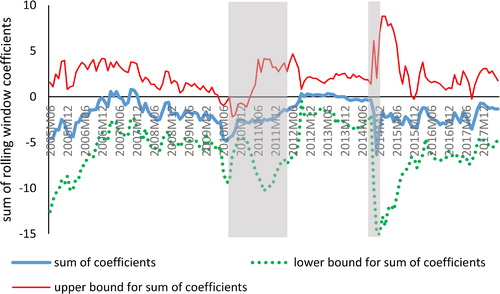
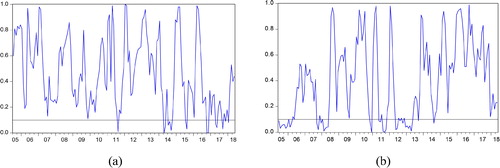
Figure 8. Bootstrap p-value of rolling test statistic testing the null that leader's visit do not Granger cause FDI inflows (outflows).
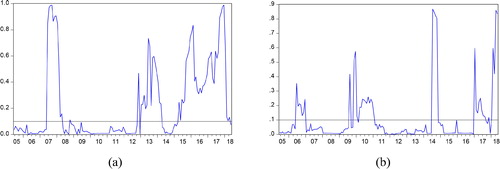
Figure 9. Bootstrap p-value of rolling test statistic testing the null that diplomatic conflict do not Granger cause FDI inflows (outflows).