
Figures & data
Figure 1. Evolution of the R&D expenditure in the EU28. Source: Eurostat and own elaboration
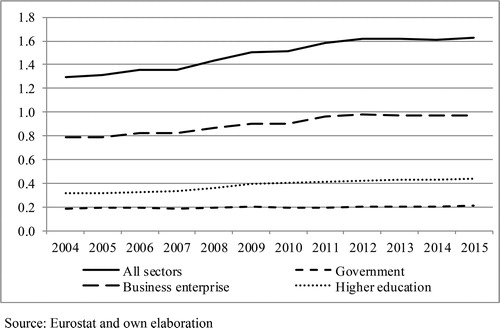
Table 1. Descriptive statistics.
Figure 2. Sigma convergence. Source: Own elaboration.
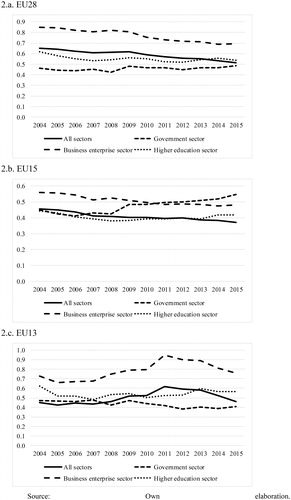
Table 2. Test of sigma convergence.
Figure 3. Average across clubs. Source: own elaboration.
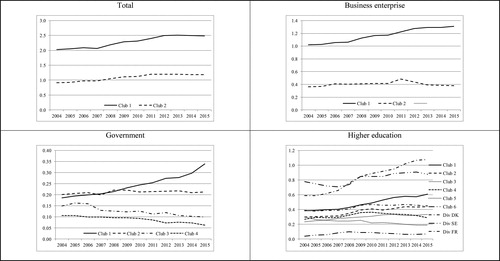
Figure 4. Average relative transition curve for each club. Source: own elaboration.
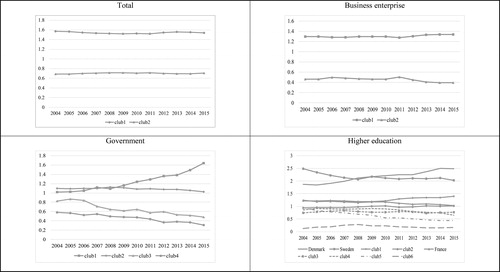
Table 3. Convergence club results: EU28.
Table 4. Summary of the results by country.
Table 5. Transitions between clubs.
Table 6. Convergence club results: EU15.
Table 7. Convergence club results: EU13.
Figure A1. Sigma convergence (per capita expenditure, EU28).
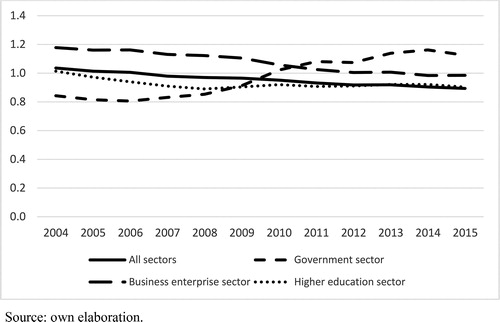
Table A1. Test of sigma convergence (per capita, EU28).
Table A2. Convergence club results – per capita expenditure.
Table A3. Comparison of main results from GDP and per capita perspectives
total.
Figure B1. Sigma convergence (source of funds, EU28).
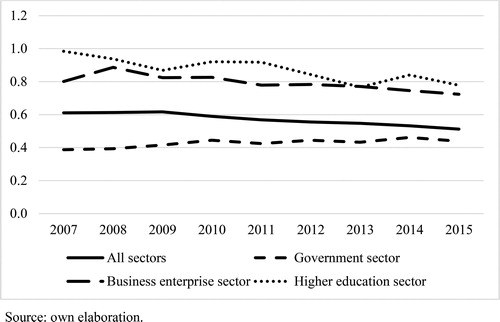
Table B1. Test of sigma convergence (source of funds, EU28).
Table A4. Comparison of main results from GDP and per capita perspectives government.
Table A5. Comparison of main results from GDP and per capita perspectives business enterprise.
A3.4. Table A6. Comparison of main results from GDP and per capita perspectives higher education.