
Figures & data
Figure 1. SCR aggregation diagram.
Source: Granito and De Angelis (Citation2015).
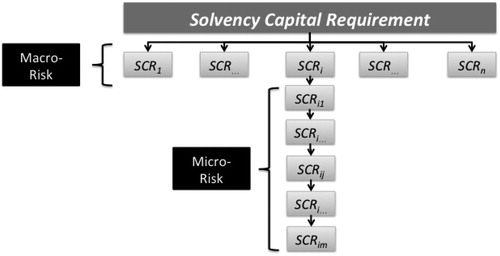
Figure 2. Annual percentage change in the Housing Price Index-HPI-.
Source: National Statistics Institute (INE, Citation2018).
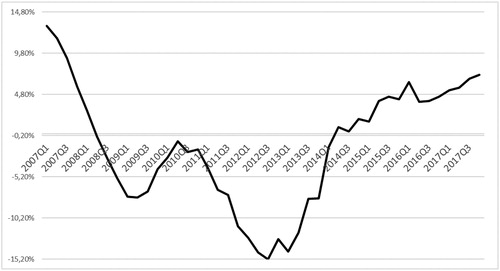
Figure 3. Theoretical frequencies.
Source: Own work.
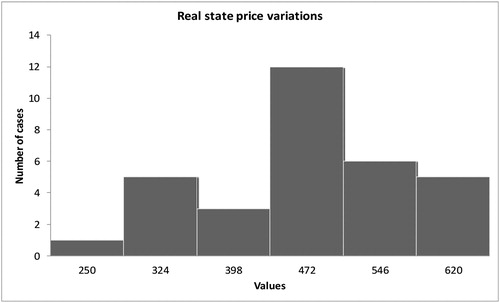
Figure 4. Theoretical frequencies.
Source: Own work.
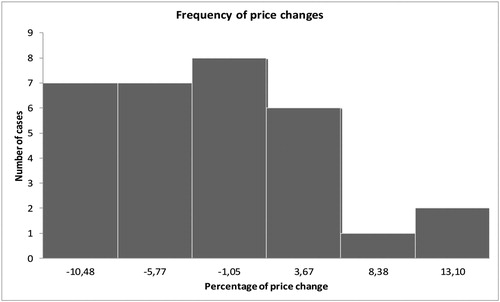
Figure 5. Theoretical and practical frequencies Variation of the HPI.
Source: Own work.
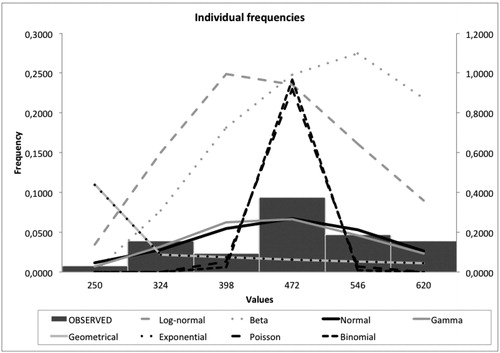
Figure 6. Cumulative theoretical and practical frequencies variation of the HPI.
Source: Own work.
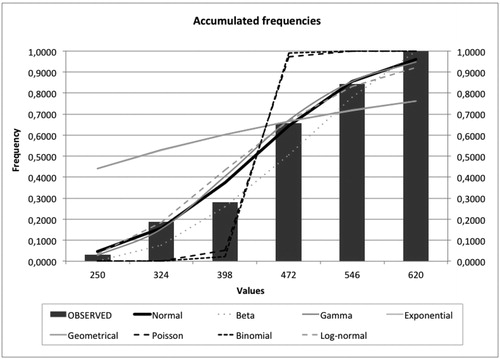
Table 1. Ranking of distributions.
Figure 7. Frequency distribution and VaR of the property portfolio.
Source: Own work.
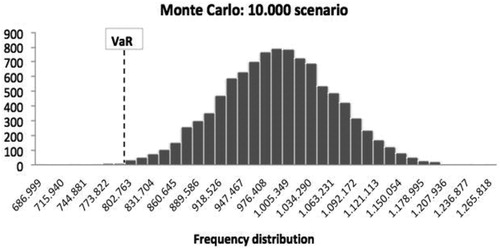
Table A1. Annual percentage change in the Housing Price Index.
Table B1. HPI statistics.
Table B2. Common distributions in the insurance sector.
Table B3. HPI variation statistics.
Table B4. Theoretical frequencies of the HPI variation.
Table B5. Goodness-of-fit of the HPI variation. Test Kolmogorov–Smirnov.
Table B6. Goodness-of-fit of the HPI variation. Test Chi-2.
Table B7. Goodness-of-fit of the HPI variation. Anderson test–Darling.