Figures & data
Figure 1. The basic framework of this study. Source: Authors' Design.
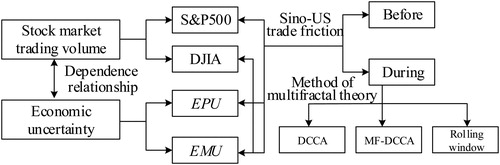
Table 1. Descriptive statistic for daily changes of D.J.I.A., S&P500 volumes and EPU, EMU.
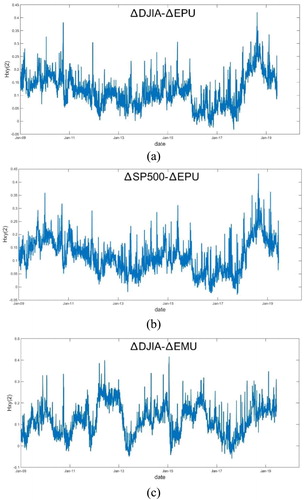
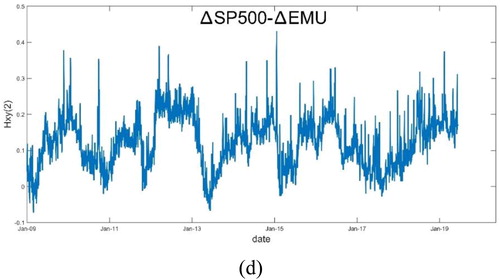
Figure 2. D.C.C.A. coefficient between stock market volume changes and economic uncertainty changes with different Sino-U.S. trade friction periods ([a, b] full period, [c, d] before period, [e, f] during period). The black curve expresses the D.C.C.A. coefficient between daily D.J.I.A. stock market trading volume changes and economic market uncertainty changes, the red curve expresses the D.C.C.A. coefficient between daily D.J.I.A. stock market volume changes and economic policy uncertainty changes, and the blue curve denotes the D.C.C.A. coefficient of
SP500-
the yellow curve denotes the D.C.C.A. coefficient of
SP500-
Source: Authors’ calculations.
![Figure 2. D.C.C.A. coefficient ρDCCA between stock market volume changes and economic uncertainty changes with different Sino-U.S. trade friction periods ([a, b] full period, [c, d] before period, [e, f] during period). The black curve expresses the D.C.C.A. coefficient between daily D.J.I.A. stock market trading volume changes and economic market uncertainty changes, the red curve expresses the D.C.C.A. coefficient between daily D.J.I.A. stock market volume changes and economic policy uncertainty changes, and the blue curve denotes the D.C.C.A. coefficient of ΔSP500-ΔEMU, the yellow curve denotes the D.C.C.A. coefficient of ΔSP500-ΔEPU.Source: Authors’ calculations.](/cms/asset/b0a869a6-5251-426b-bb01-62b3ecbbf286/rero_a_1758185_f0002_c.jpg)
Table 2. for volatility linkages of trading volumes changes and economic uncertainty.
Figure 3. The Renyi exponent versus q for daily trading volume changes of stock markets and daily changes in two different measurement economic uncertainty. (a) denotes
of
DJIA-
for different periods, (b) denotes
of
SP500-
for different periods, (c) denotes
of
DJIA-
for different periods, (d) denotes
of
SP500-
for different periods. The blue curves denote the
for the full period, the red curves denote the
for the before-Sino-U.S. trade friction period, the black curves denote the
for the during-Sino-U.S. trade friction period using M.F.-D.C.C.A.
Source: Authors’ calculations.
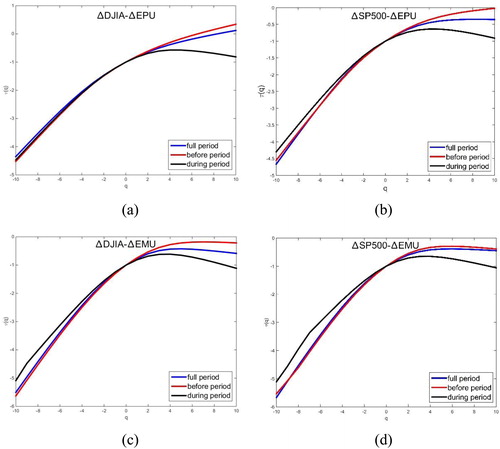
Figure 4. Nonlinear relationship of versus
for daily stock market trading volume changes and daily changes of economic uncertainty movements. (a) denotes
versus
of
DJIA-
for different periods, (b) denotes
versus
of
SP500-
for different periods, (c) denotes
versus
of
DJIA-
for different periods, (d) denotes
versus
of
SP500-
for different periods. The blue, red, black curves denote
for the full period, the before-Sino-U.S. trade friction period, the during-Sino-U.S. trade friction period by M.F.-D.C.C.A., respectively.
Source: Authors’ calculations.
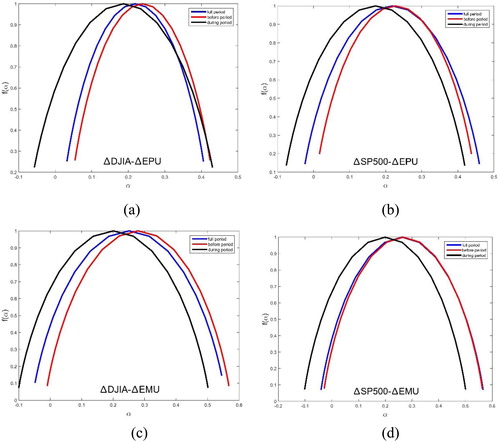
Table 3. Estimated parameters of the multifractal spectrum.