
Figures & data
Table 1. Variable definitions.
Table 2. Summary statistics.
Table 3. The estimation results of corruption’s effects on firms’ access to bank loans.
Figure 1. The role of government guarantees in corruption affecting firm financing.
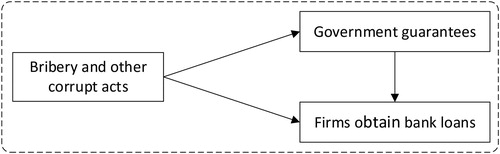
Table 4. The structural path coefficients of corruption.
Table 5. The indirect effects and total effects of corruption.
Table 6. The estimated results of OLS regression.
Figure 2. The estimation diagram of dose-response function and treatment effect.
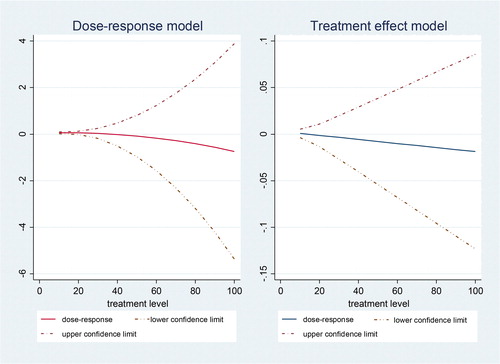
Table 7. The effects of corruption on firms’ bank loan intensity.
Table 8. Results of robustness test.