
Figures & data
Table 1. Standard Grubel–Lloyd index 2007 and 2018 for merchandise trade between WB economies.
Table 2. Shares of (Medium- and) High-Tech products, Skill-intensive manufactures, and High-skill and technology-intensive manufacture products in merchandise trade flows between WB economies in 2007 and 2018.
Table 3. Export concentration ratio (Herfindahl-Hirschmann index) in 2007 and 2018 (merchandise export from one WB economy to another).
Figure 1. The shares of the rest of the WB countries in total exports and imports of six WB countries. Source: See Appendix 1.
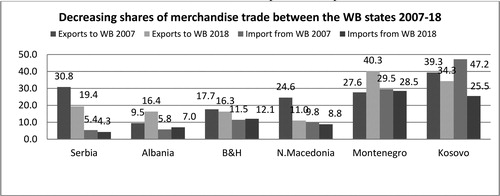
Table A1. The average trade growth rate 2007-18; total and to the rest of the WB (expressed in EUR).
Table A2. The Volume and Growth of WB6’s Total Trade and Trade with the EU28 2007-2018 (EUR million, %).
Table A3. Standard Grubel–Lloyd index of intra-industry trade of WB countries with EU28 in 2007 and 2018.
Table A4. Shares of (Medium- and) High-Tech products, High-skill and technology-intensive manufacture products, and Skill-intensive manufactures in WB exports 2007 and 2018.
Table A5. Shares of goods at higher levels of processing in WB merchandise export to the EU 28.
Table A6. Herfindahl-Hirschmann index for WB countries trade with EU 28 in 2007 and 2018.