
Figures & data
Table 1. List of latent and observed variables in the hypothesised conceptual model.
Figure 1. Proposed conceptual model of direct and mediating influence of trust crisis in the financial sector on macroeconomic stability. Source: Author’s elaboration.
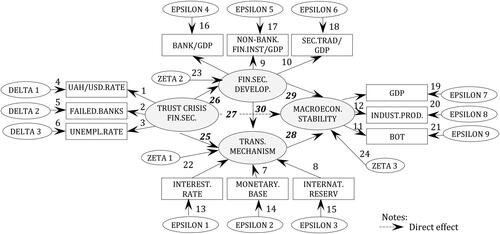
Figure 2. Graphical representation of the mediation model of the study. Source: Author’s elaboration.
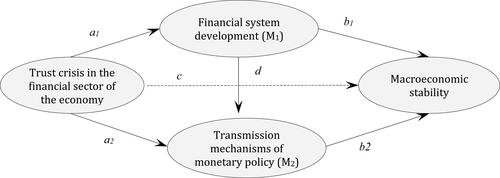
Figure 3. Output path diagrams. (a) The measurement model of the trust crisis in the financial sector. (b) The measurement model of the macroeconomic stability. (c) The measurement model of the monetary policy transmission mechanism. (d) The measurement model of the financial development. Source: Created by the authors based on their own calculation.
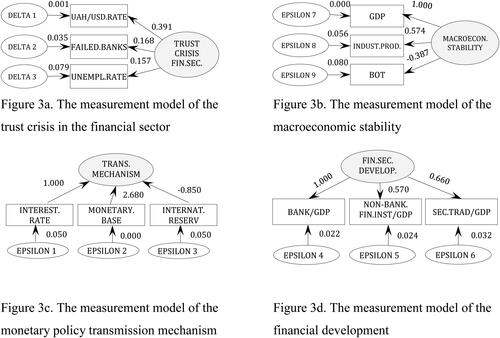
Table 2. Hypotheses testing summary.
Figure 4. Graphical representation of the mediation model of the study with path coefficients. Source: Created by the authors based on their own calculation.
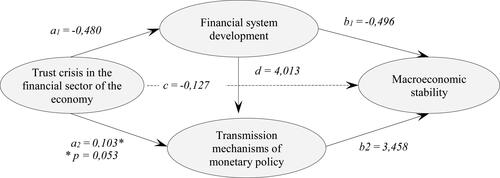
Table 3. Mediating effects and hypotheses testing summary.
Table 4. Goodness-of-fit statistics of the hypothesised conceptual model.