Figures & data
Table 1. The average of standardized mean and variance of the cumulative asset return from the simulation results.
Table 2. The average of standardized skewness and kurtosis of the cumulative asset return from the simulation results.
Figure 1. Average of simulation results of an analytical approximation for call option prices. Source: Created by the authors.
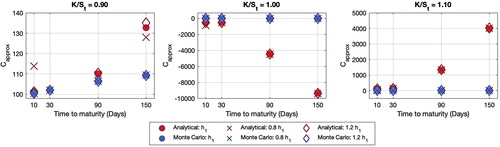
Figure 2. Average of simulation results of an analytical approximation for call option prices: ‘ITM Cases’. Source: Created by the authors.
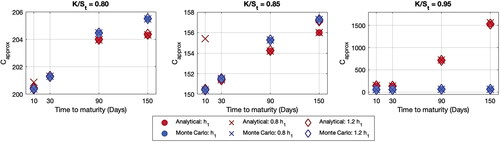
Figure 3. Impact of skewness and kurtosis correspondence on call option prices. Source: Created by the authors.
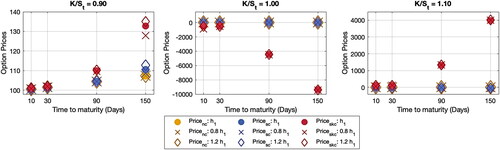
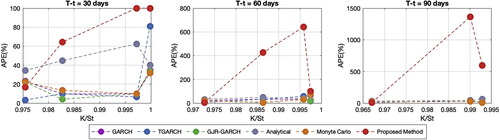
Figure 4. CORR, MAPE, RMSE and MaxAPE of call option prices. Source: Created by the authors based on SET50 data.
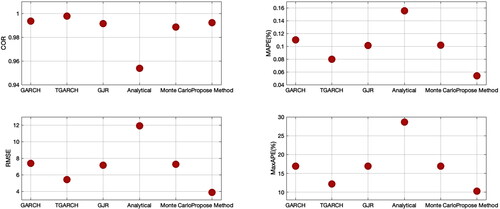
Table 3. The performance of option prices with
Figure 5. Impact of correspondence on call option prices. Source: Created by the authors based on SET50 data.