
Figures & data
Table 1. European Union top international economics policy think tanks.
Table 2. Conditions.
Table 3. Calibration and descriptive statistics.a
Figure 1. Regression of world media representation of the sample (19 think tanks).
Source: Own elaboration
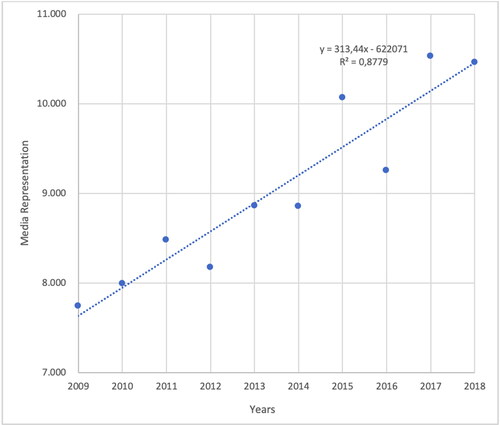
Figure 2. Growth of world media representation per years of the sample (19 think tanks).
Source: Own elaboration
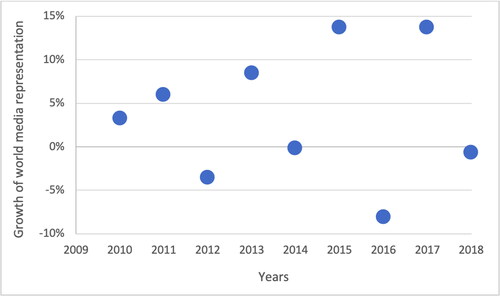
Figure 3. Growth of world media representation, per years and per think tanks.
Source: Own elaboration
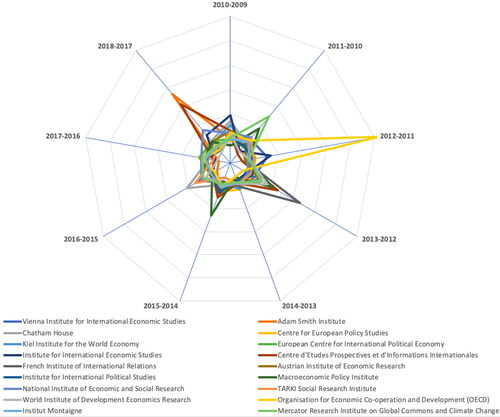
Table 4. Analysis of necessary conditions.
Table 5. Analysis of sufficiency for the outcome growth of world media representation(b).
Table 6. Successful strategies(c).
Table 7. Unsuccessful strategies(d).