
Figures & data
Figure 1. Euribor performance for 3-month and 12-month terms, evolution of the panel banks, and range and standard deviation of quotes for 3-month 12-month terms (2004-2018).
Source: Own elaboration on EMMI (Citation2019).
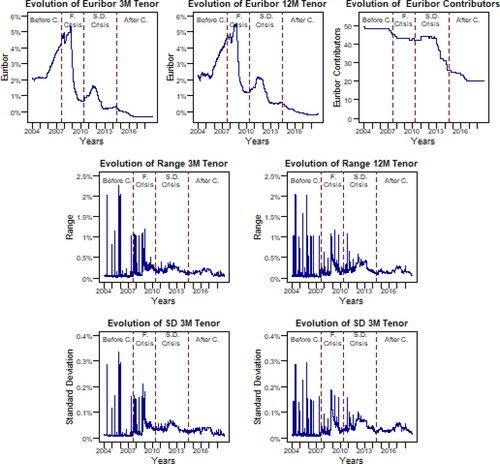
Table 1. Percentage of quotes above high cut-off point (TOP), within computation range (IN) and below low cut-off point (BOTTOM) over the study period.
Figure 2. Comparison of the contribution behaviour of the banks of the panel in the manipulation period (2007-2013).
Source: Own elaboration on EMMI (Citation2019).
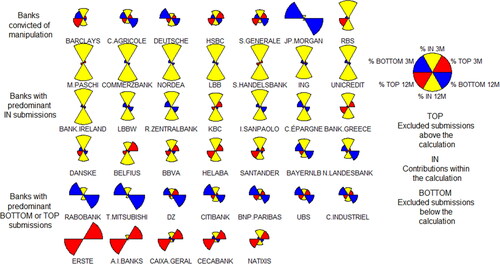
Table 2. Percentage of quotes in the top-3 values (TOP), non-extreme values (IN) and bottom-3 values (BOTTOM).
Table 3. Potential for manipulation of Euribor.
Figure 3. Potential for upward and downward manipulation, for 3-month and 12-month terms.
Source: Own elaboration.
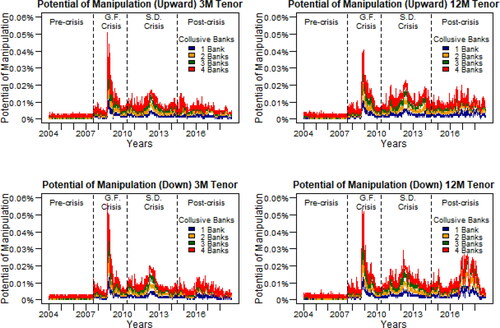
Table 4. One sample t-test results.
Table 5. Potential for manipulation of trimmed mean, median and mode.
Table 6. Mean and standard deviation of differences between observed Euribor rates and rates computed with the median and the mode for 3-month and 12-month terms.