
Figures & data
Table 1. Estimates of the UE in WB economies.
Figure 1. General structure of the MIMIC approach.
Source: Schneider and Enste (Citation2000).
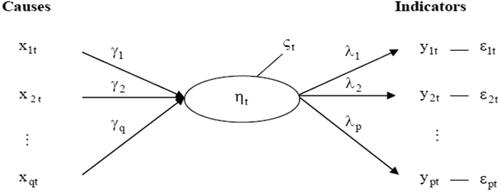
Table 2. Parameters estimated by the MIMIC model for 19 NMS and WB economies.
Table 3. Non-observed economy based on the Eurostat approach.
Figure 2. Estimate of the UE, excluding illegal activities, for WB economies, in the percentage of GDP.
Source: Authors’ calculations.
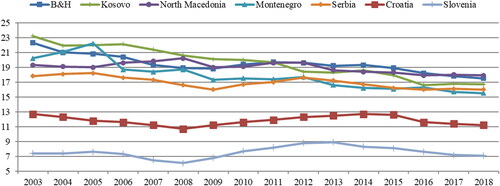
Table 4. Estimate of the UE in WB economies, a combination of the MIMIC and Eurostat approaches, excluding illegal activities, in percentage of GDP.
Figure 3. Distribution of answers on personal experiences with purchasing products delivered by the UDW sector.
Source: Survey data.
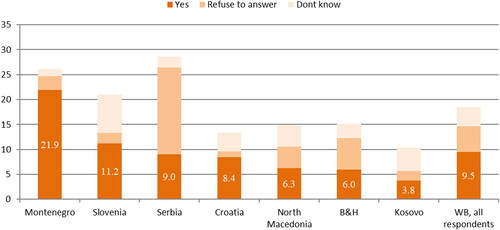
Table 5. Persons declaring experience in purchasing products delivered by the UDW sector by socioeconomic groups, in percentage of the total number of respondents per country.
Figure 4. Percentage of respondents receiving underreported income.
Source: Survey data.
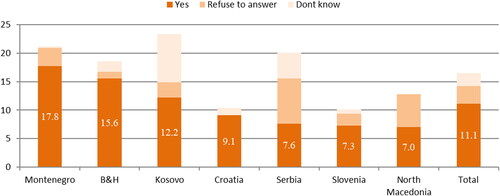
Figure 5. Percentage of respondents receiving compensation in money or a kind of undeclared secondary activity.
Source: Survey data.
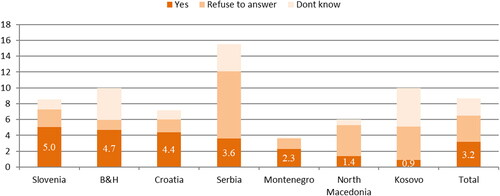
Figure 6. Total undeclared income estimated by the survey, in the percentage of GDP.
Source: Authors’ calculation based on the survey.
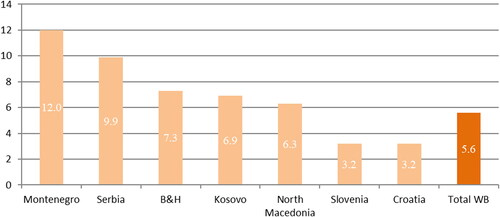
Table 6. Persons declaring experience on undeclared secondary employment by socioeconomic groups, in percentage of the total number of respondents per country.
Table 7. Total income generated by UDW, in EUR million.
Figure 7. Comparison of undeclared income based on survey results and underground economy (N1 + N6) estimated by the MIMIC approach, in the percentage of GDP.
Source: Authors’ calculations.
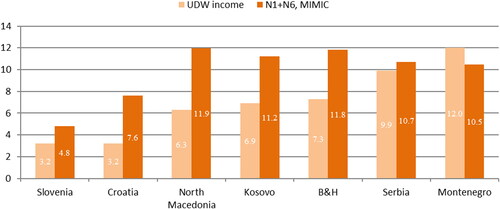
Table 8. Main advantages and limitations of essential UE measurement methods.