
Figures & data
Figure 1. Unemployment rate in Slovakia, EU neighbouring countries and EU average. Source: Author based on (Eurostat, Citation2018c).
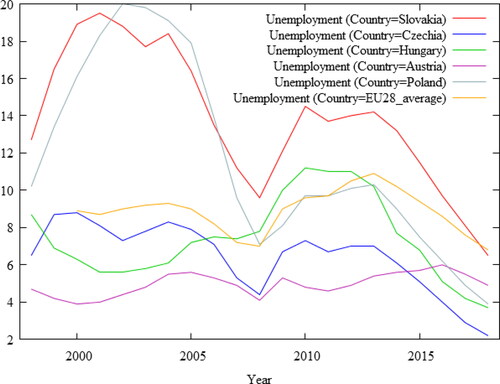
Table 1. Labour market efficiency.
Figure 2. Labour market efficiency of Slovakia and EU neighbouring countries, index.
Source: Constructed by the author based on World Bank (Citation2019).
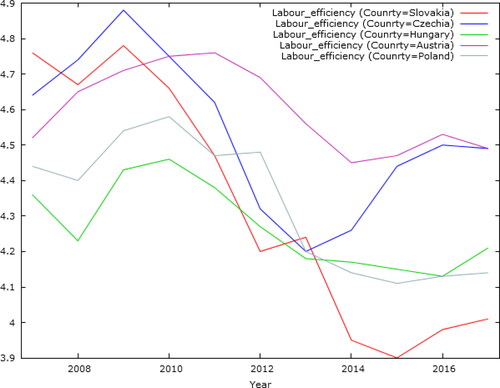
Figure 3. Emigration flows from Slovakia to its neighbouring EU countries, number.
Source: Author based on Eurostat (Citation2019b).
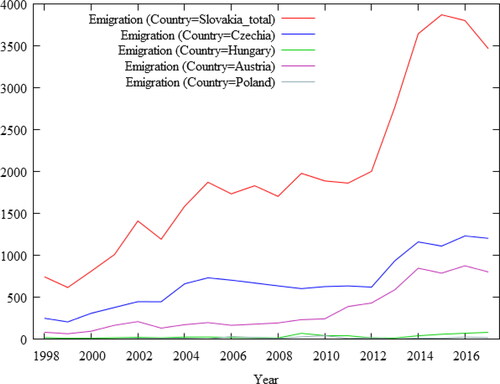
Table 2. Top countries of citizenship of permanent and long-term residence permit holders in the Czech Republic, 2017.
Figure 4. Migrant employment in sectors, the Czech Republic, 2017.
Source: Author based on (Czech Statistical Office, Citation2019b).
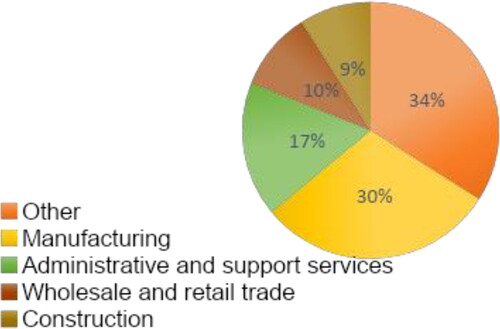
Table 3. The emigration decision.
Table 4. Description of variables.
Table 5. Summary statistics.
Table 6. Regression analysis: OLS.
Table 7. Heteroskedasticity test and normality of residual test.
Table 8. Collinearity test: variance inflation factors.