
Figures & data
Table 1. Descriptions of MFIs specific, macroeconomic and economic freedom variables.
Figure 1. Trend of social efficiency score in 2011–2018. Source: Microfinance Information Exchange (MIX), and authors’ own calculations.
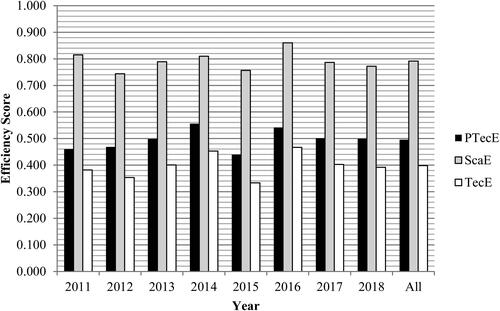
Figure 2. Trend of financial efficiency score in 2011–2018. Source: Microfinance Information Exchange (MIX), and authors’ own calculations.
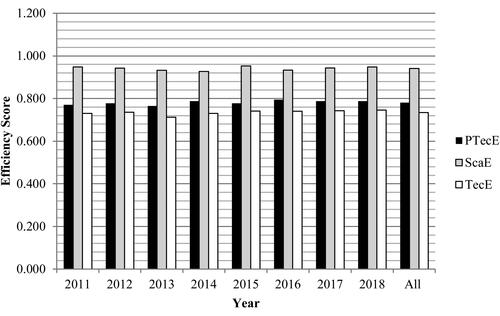
Table 2. Descriptive statistics of MFIs social and financial efficiency.
Table 3. Parametric and non-parametric robustness test for social and financial efficiency scores.
Table 4. Regression result on the social efficiency of microfinance institutions.
Table 5. Regression result on the financial efficiency of microfinance institutions.