
Figures & data
Figure 1. Employment change in N79 due to National Trends; National Growth Effect in EU28 during 2008–2016 period at NUTS 2 level.
Source: Map made by authors, ESRI SHAPE file.
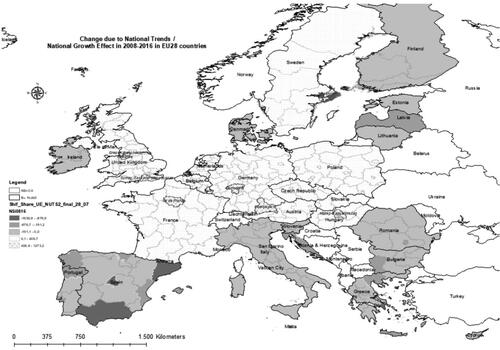
Table 1. Number of regions by countries with regional employment growth in N79 higher than total growth employment rate during 2008–2016 in EU28: number of regions with competitive advantage in the N79 sector [number of regions].
Table 2. Selected regions by countries with N79 regional employment positive modification, higher than 406 employees, during 2008–2016 period, in EU28: the regions with competitive advantage a best employment performance [employed persons].
Figure 2. Employment change in N79 due to Industrial Mix; Industrial Mix Effect in EU28 during 2008-–2016 period at NUTS 2 level.
Source: Map made by authors, ESRI SHAPE file.
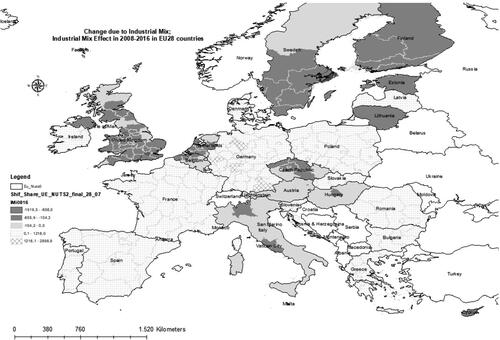
Table 3. Number of regions by countries specialised in N79 during 2008–2016 in EU28 [number of regions].
Table 4. Selected regions by countries with a positive total industry mix effect higher than 1216 employees in N79 at NUTs 2 level, during 2008–2016 period, in EU28. The amount of growth regarded as being caused by the differences in sectoral employment in N79 and the employment growth at national level. [Employed persons].
Figure 3. Employment change in N79 due to Regional shift or Competitive Effect in EU28 during 2008–2016 period at NUTS 2 level.
Source: Map made by authors, ESRI SHAPE file.
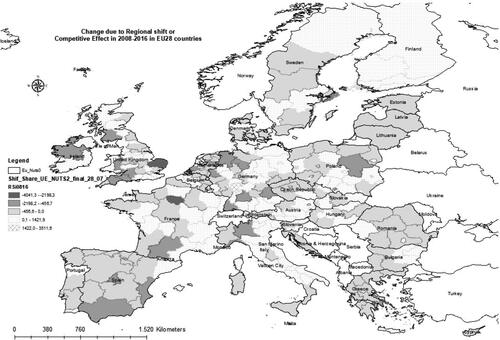
Table 5. Number of regions in which the N79 has a positive competitive effect – the employment in the N79 in these regions grows faster than the employment in the N79 sector at national average growth rate: the growth is given by the specific of the region [number of regions].
Table 6. Selected regions by countries with a positive competitive effect higher than 1422 employees in N79 at NUTS 2 level, during 2016–2018 period, in EU28. Regions where the N79 employment is growing faster than the national average industry growth rate. [Employed persons].
Annex 1. NUTS 2 regions with data in other years than the reference interval 2008 and 2016.
Annex 2. National Share of N79 employment EU countries profiles at NUTS 2 level.
Annex 3. Industrial Mix Share over N79 employment EU countries profiles at NUTS 2 level.
Annex 4. Regional Shift (Or Local Share)/Competitive Effect of N79 employment EU countries profiles at NUTS 2 level.