
Figures & data
Table 1. The percentage of households at risk of poverty: cross-country summary statistics.
Figure 1. The percentage of households at risk of poverty in the EU countries.
Note: Own calculations based on EU-SILC 2018 data (due to data unavailability, the indicators for Ireland, the Slovak Republic, and the United Kingdom are for 2017). The poverty threshold is set at 60% of the national median equivalised disposable income.
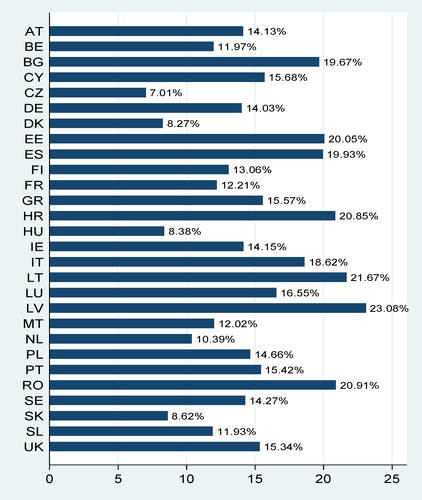
Table 2. Number of households in data set and the share of households at risk of poverty in countries which have low-, middle- and high-ranking position in terms of relative poverty.
Table 3. The average benefit rate, the average extra benefit rate, and the ratio of poverty threshold to original income.
Table 4. The disposable income Gini coefficient, the extra benefit concentration coefficient, the extra benefit progressivity coefficient, the ratio of the Gini coefficient to the extra benefit progressivity coefficient in the first group of households, and additional benefits as a proportion of benefits that have already been allocated.
Table 5. The between-groups Gini coefficient of hypothetical disposable income, the product of population share and hypothetical income share of the second group of households, the Gini coefficient of disposable income in the second group of households, the Gini coefficient of hypothetical disposable income, the Gini coefficient of disposable income, and the redistributive effect of extra benefits.