
Figures & data
Figure 1. Changing of the Malmquist, EFFCH, TECH and MTECH across time.
Source: the author based on the original data and empirical results.
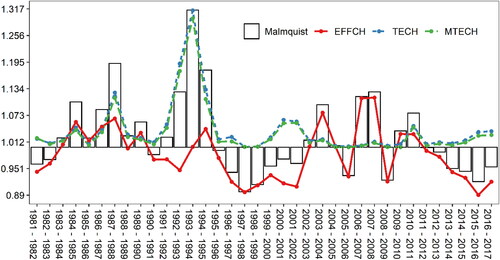
Figure 2. Changing of the average Malmquist, EFFCH, TECH and MTECH across provinces.
Source: the author based on the original data and empirical results.
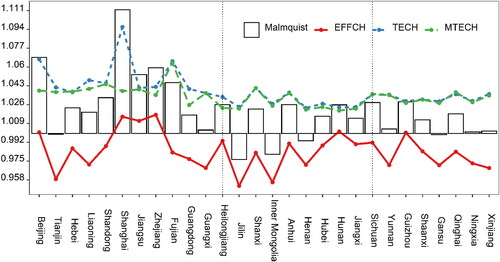
Table 3. The agricultural technology progress direction from 1981 to 2017.
Table 4. Results of agricultural technology progress direction by region from 1981 to 2017.
Table 5. Panel unit root tests results.
Table 6. Panel cointegration tests results.
Table 7. Benchmark regress results.
Table 8. Mechanism test results.
Table 1. Input mix and input bias towards technological progress.
Table 2. Descriptive statistics of variables.