
Figures & data
Figure 1. The average number and growth rate of city-level bank branches.
Data Source: China Banking and Insurance Regulatory Commission (CBRC) website.
Source: this study.
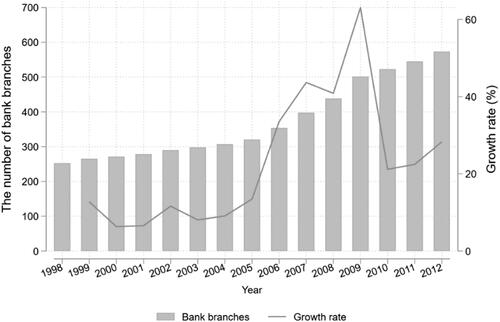
Figure 2. The regional distribution of the proportion of the ‘Big Four’ banks’ branches account for local banking branches in 1986, 2001, 2009 and 2019.
Data Source: China Banking and Insurance Regulatory Commission (CBRC) website.
Source: this study.
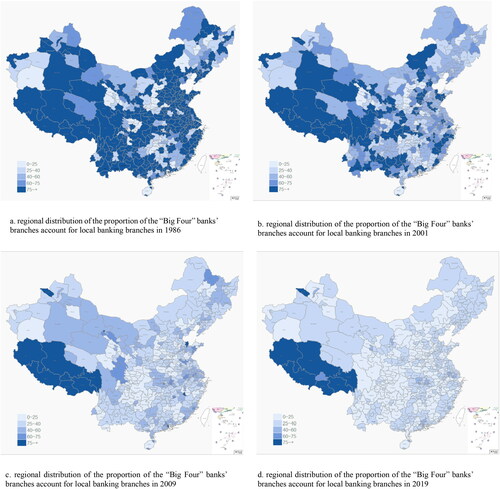
Table 1. Variable definitions.
Table 2. Summary statistics.
Table 3. Estimation results of the basic regression model to test the impact of bank competition on firms’ pollution reduction.
Table 4. Estimation results of instrumental variable (IV) regressions.
Table 5. Estimation results of mechanisms test of financial constraints channel.
Table 6. Estimation results of mechanisms test of specific ways.
Table 7. The threshold value of environmental regulation.
Table 8. Regression results of panel threshold models.
Table 9. Regression analyses of different industries and years.