Figures & data
Figure 1. Maturity structure of Chinese Commercial Banks loan.
Source: Original data is from the People’s Bank of China.
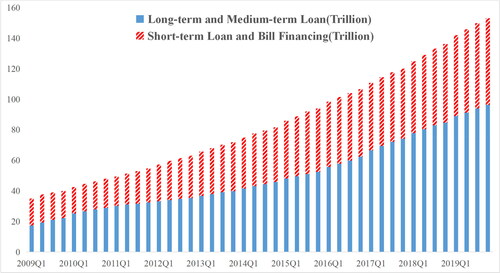
Figure 2. 2007Q1–2019Q4 The changes of LMI in the banking system of China. Note: The original data is from the People’s Bank of China.
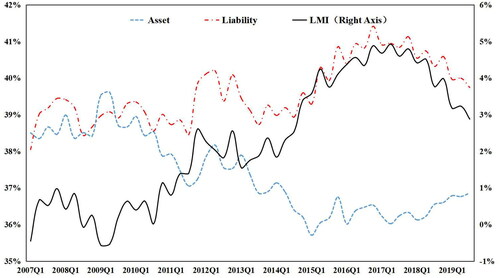
Table 1. Benchmark calibration.
Table 2. Prior and posterior distributions of the parameters.
Table 3. Marginal data density.
Figure 3. Impulse responses to technological shock.
Source: the simulation results are calculated by the authors with Dynare 4.5.7.
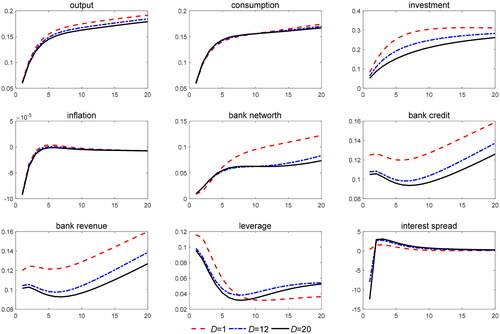
Table 4. Relative volatility of variables in Baseline model.
Figure 4. Impulse responses to monetary policy.
Source: the simulation results are calculated by the authors with Dynare 4.5.7.
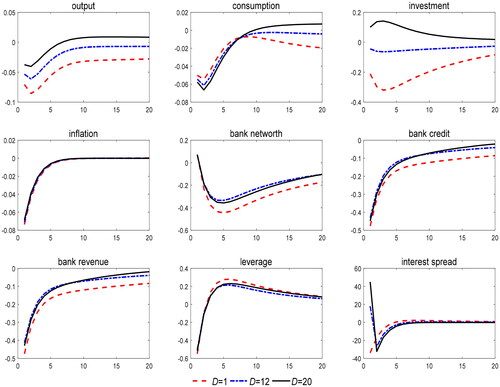
Figure 5. Impulse responses to bank net worth shock.
Source: the simulation results are calculated by the authors with Dynare 4.5.7.
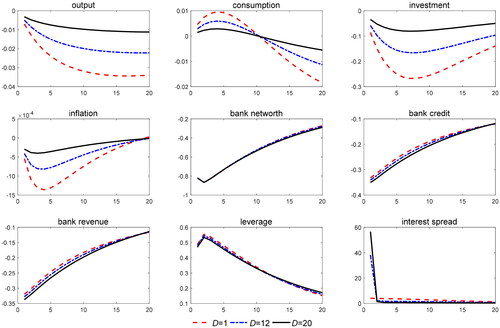
Table 5. Relative volatility of variables under macroprudential policy.
Figure 1. Loan Proportions in Total Bank Loans of 9 Major Industries
Note: The original data is collected from Wind Financial Database.
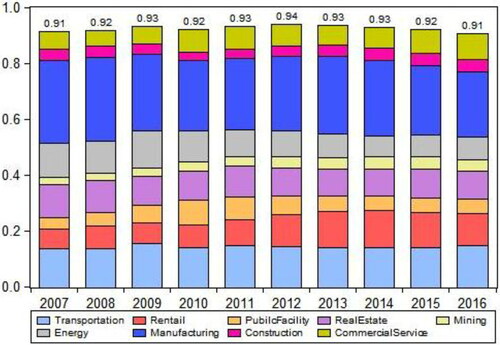
Table 1. Investment Horizon and Loan Proportions of Industries
Note: The original data is collected from Wind Financial Database.
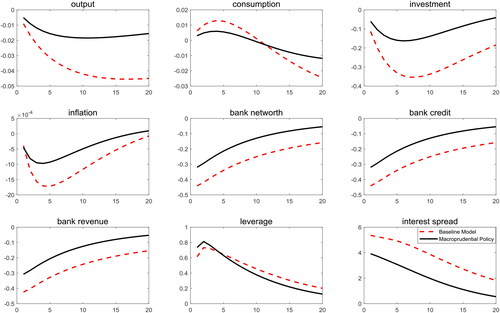
Figure 1. Macroprudential Policy experiment with Technological Shock.
Notes: the simulation results are calculated by the authors using Dynare 4.5.7.
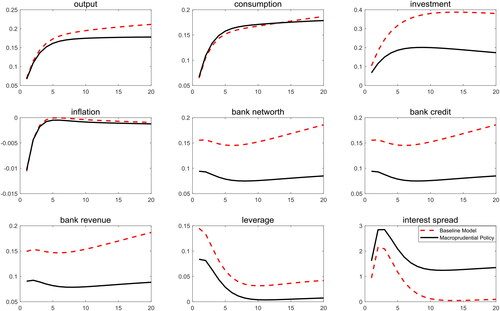
Figure 2. Macroprudential Policy experiment with Monetary Policy Shock.
Notes: the simulation results are calculated by the authors using Dynare 4.5.7.
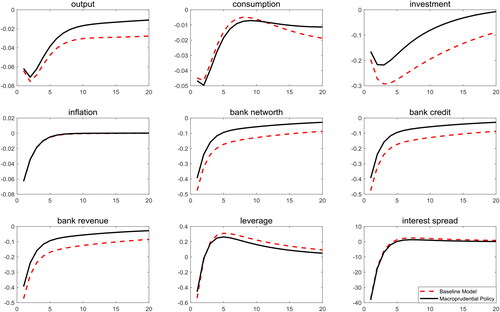
Figure 3. Macroprudential Policy experiment with Bank Net Worth Shock.
Notes: the simulation results are calculated by the authors using Dynare 4.5.7.