
Figures & data
Figure 1. Schematic Representation of Proposed Relationships.
Source: Author's anaysis.
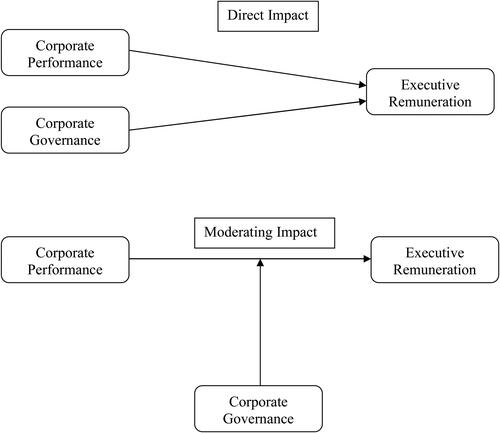
Table 1. Description of Variables.
Table 2. Descriptive statistics.
Table 3. Correlation matrix.
Table 4. Baseline static and dynamic pay-performance model.
Table 5. Static and dynamic pay model for SOEs and NSOEs.
Table 6. Moderating effect of corporate governance between pay-performance relationship.
Table A1. Notable prior studies from Chinese context on Executive Remuneration.