
Figures & data
Figure 1. National trends in China’s official poverty headcount, 1978–2015.
Source: The Central People’s Government (2018).
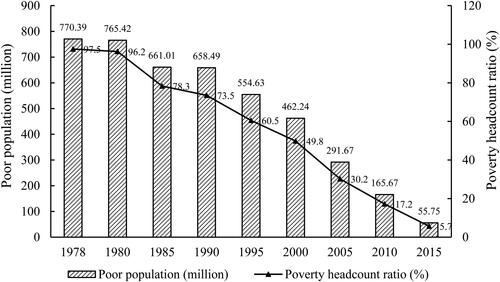
Table 1. Definitions, codes, and measurement methods of the variables.
Table 2. Summary statistics of the variables.
Table 3. Spatial autocorrelation test of the poverty level from 1997 to 2015.
Table 4. Panel unit root test.
Table 5. Panel cointegration test.
Table 6. Regression results of rural financial development on poverty level.
Table 7. Results of robustness check.
Table 8. Regression results of rural financial development on urban-rural income inequality.
Table A1. Estimates of spatial lag explanatory variables of SDM model.