
Figures & data
Table 1. Evaluation system indicators.
Table 2. Quantitative indicator data.
Table 3. Data of Qualitative indicator
Table 4. Data of Qualitative indicator
Table 5. Data of Qualitative indicator
Table 6. Data of Qualitative indicator
Table 7. Attributes’ high and low thresholds.
Figure 1. Strong outranking graph and weak outranking graph
Source: The Authors.
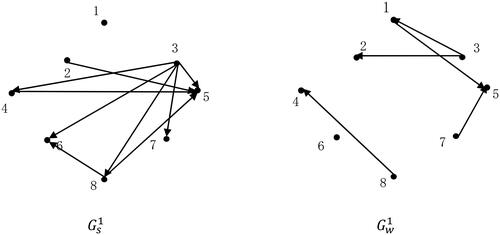
Figure 2. The strong outranking graph and the weak outranking graph
Source: The Authors.
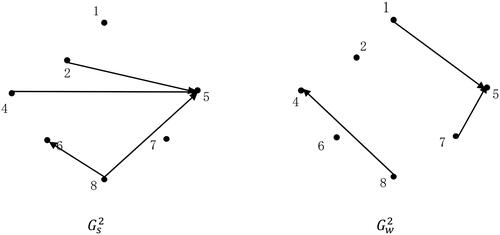
Figure 3. The strong outranking graph and the weak outranking graph
Source: The Authors.
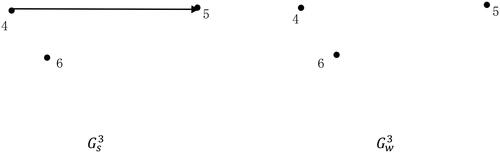
Figure 4. The strong outranking graph and the weak outranking graph
Source: The Authors.
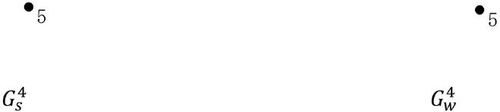
Table 8. Forward order of all alternatives.
Table 9. Reverse order and average order of all alternatives.