Figures & data
Table 2. The equilibrium outcomes at
Table 3. The equilibrium outcomes at
Table 4. The equilibrium outcomes at
Figure 1. The IPR, adjusted IPR andlaw enforcement of China.
Source: The calculations of this model with the methods of Qi et al (Citation2008) and Han and Li (Citation2005).
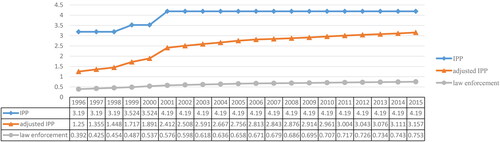
Table 1. The relevant intervals of a given IPR index.
Figure 2. The profits of foreign firm with the strength of law enforcement.
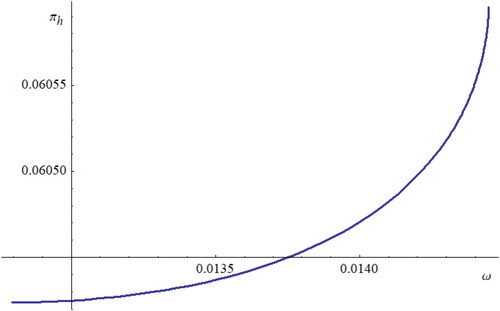
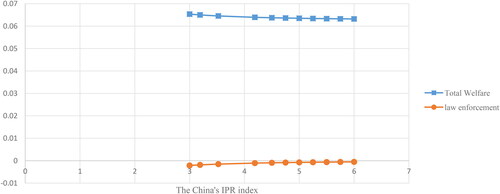
Figure 3. The total welfareand law enforcement of China (developing country).