
Figures & data
Table 1. Input indicators and output indicators of finance system and sci-tech system.
Figure 1. Sci-tech finance collaborative system.
Source: the author based on the variable relation.
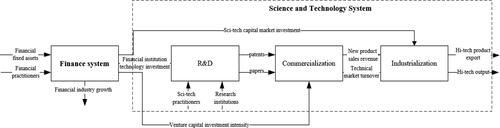
Figure 2. Collaborative structure of sci-tech finance.
Source: the author based on the variable relation.
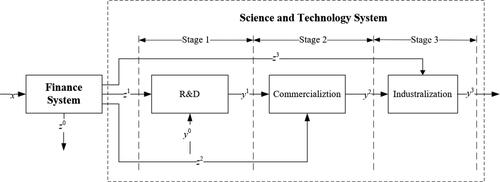
Table 2. Notation and definition.
Table 3. 2009-2016 China's provincial sci-tech finance collaborative efficiency and subsystem efficiency.
Figure 3. The spatial distribution of sci-tech finance collaborative efficiency.
Source: the author based on the original data and empirical results.
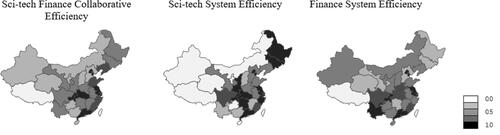
Figure 4. National sci-tech finance collaborative efficiency mean line chart.
Source: the author based on the original data and empirical results.
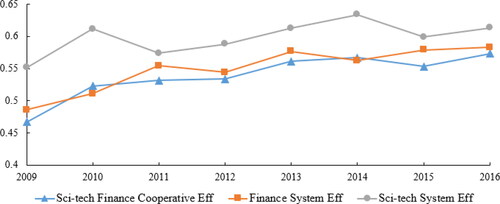
Figure 5. R&D and commercialization stage percentage comparison chart.
Source: the author based on the original data and empirical results.
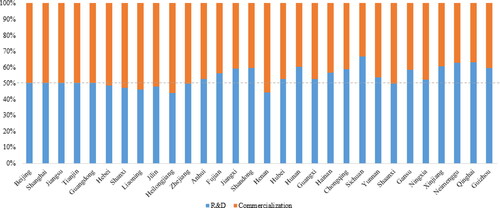
Table 4. Insufficient DEA output analysis.
Figure 6. The Moran Index value line chart of sci-tech finance collaborative efficiency.
Source: the author based on the original data and empirical results.
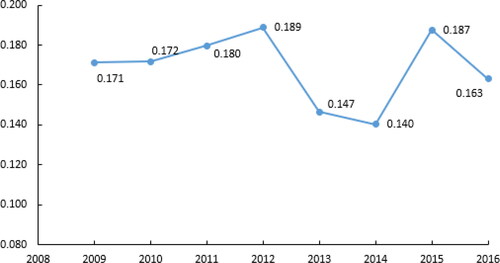
Figure 7. The Moran scatter diagram of sci-tech finance collaborative efficiency.
Source: the author based on the original data and empirical results.
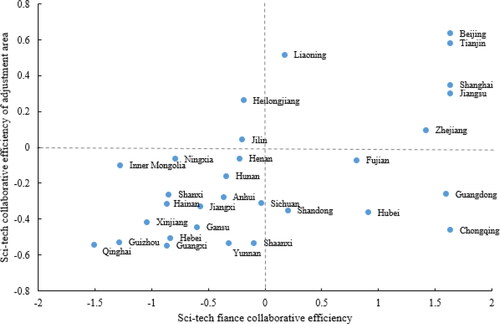
Table 5. Sci-tech finance collaborative efficiency influencing factors.
Table 6. Descriptive statistical analysis.
Table 7. The regression result of the influence factor of sci-tech finance collaborative efficiency.