
Figures & data
Table 1. Variable description.
Table 2. Descriptive statistics.
Table 3. Government subsidy and enterprise R&D investment.
Table 4. Government subsidy and enterprise R&D efficiency.
Figure 1. Variation of estimated coefficient (R&D investment as the explained variable).
Source: The authors.
Note: The curve composed of black dots in the figure is the quantile regression estimation result of each explanatory variable, and the shaded part is the confidence interval of quantile regression estimation value (the confidence level is 95%); The red straight line represents the OLS regression estimation of explanatory variables, and the area between two thin red dotted lines represents the confidence interval of the OLS regression estimation (the confidence level is 95%); The horizontal axis represents the different quantiles of R&D investment level, and the vertical axis represents the regression coefficient of each variable.
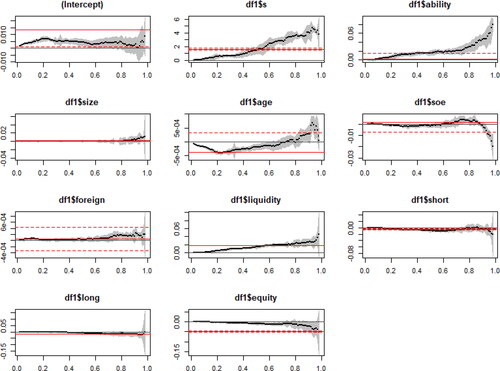
Figure 2. Variation of estimated coefficient (R&D efficiency as the explained variable).
Source: The authors.
Note: The curve composed of black dots in the figure is the quantile regression estimation result of each explanatory variable, and the shaded part is the confidence interval of quantile regression estimation value (the confidence level is 95%); The red straight line represents the OLS regression estimation of explanatory variables, and the area between two thin red dotted lines represents the confidence interval of the OLS regression estimation (the confidence level is 95%); The horizontal axis represents the different quantiles of R&D investment level, and the vertical axis represents the regression coefficient of each variable.
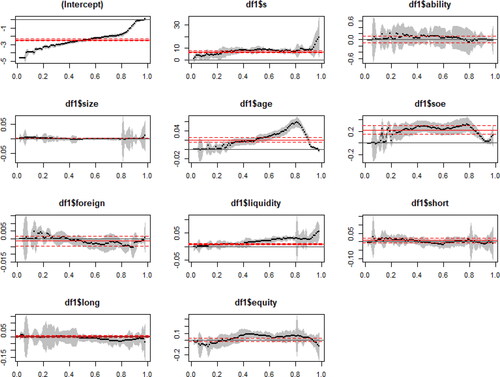
Table 5. Estimation results of SQAR model.