Figures & data
Figure 1. Shanghai index during the COVID-19 (left) and SARS (right) epidemics.
Source: By authors.
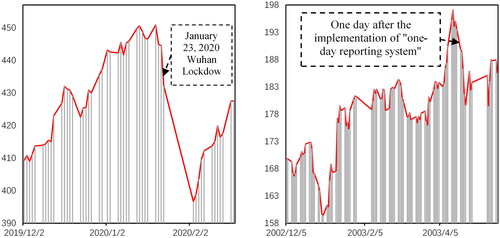
Figure 2. Covariates during the COVID-19 (left) and SARS (right) outbreaks.
Source: By authors.
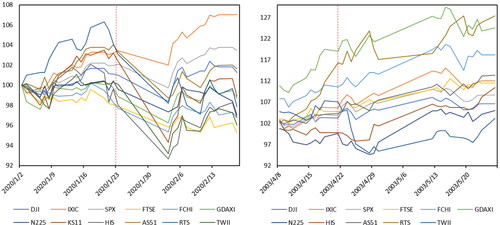
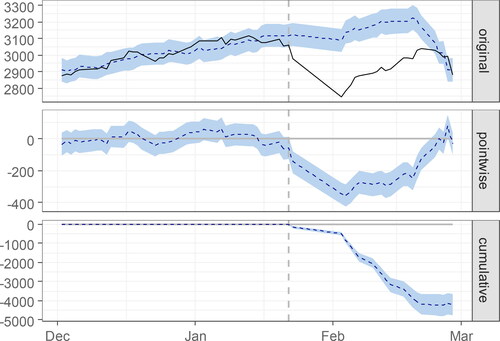
Figure 3. The time-varying causal effect of COVID-19 on the Shanghai index.
Note: (a) In the time series of the Shanghai index, the dotted line is the counterfactual forecast value, (b) pointwise (daily) incremental impact of COVID-19, (c) cumulative impact of COVID-19.
Source: Authors' calculations.
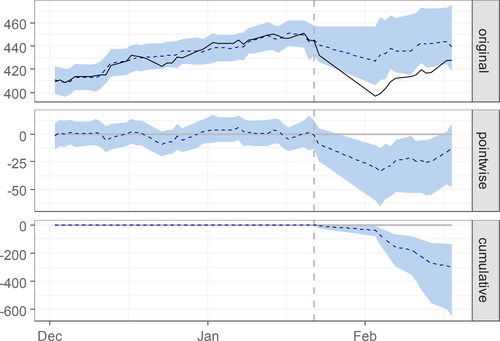
Figure 4. The time-varying causal effect of SARS on the Shanghai index.
Note: (a) In the time series of the Shanghai index, the dotted line is the counterfactual forecast value, (b) pointwise (daily) incremental impact of the SARS, (c) cumulative impact of SARS.
Source: Authors' calculations.
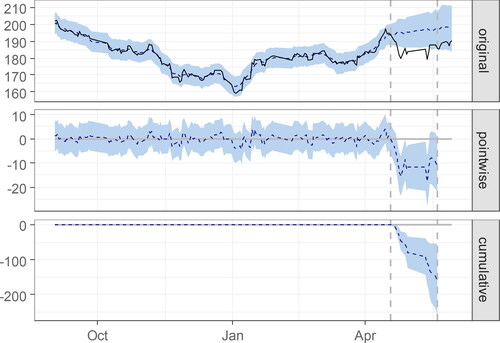
Table 1. The average causal effect of COVID-19 and SARS on the Shanghai index.
Figure 5. Re-selection of covariates (COVID-19).
Note: (a) The time series of the Shanghai index, the dotted line is the counterfactual forecast value, (b) pointwise (daily) incremental impact of COVID-19, (c) cumulative impact of COVID-19.
Source: Authors' calculations.
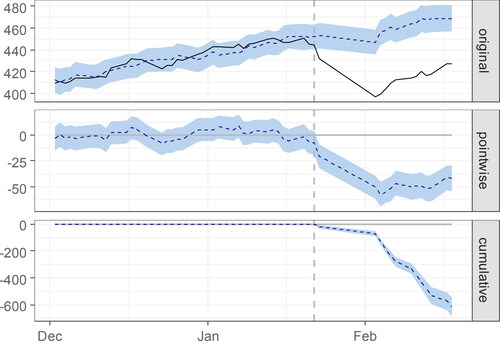
Figure 6. Re-selection of covariates (SARS).
Note: (a) The time series of the Shanghai index, the dotted line is the counterfactual forecast value, (b) pointwise (daily) incremental impact of the SARS, (c) cumulative impact of SARS.
Source: Authors' calculations.
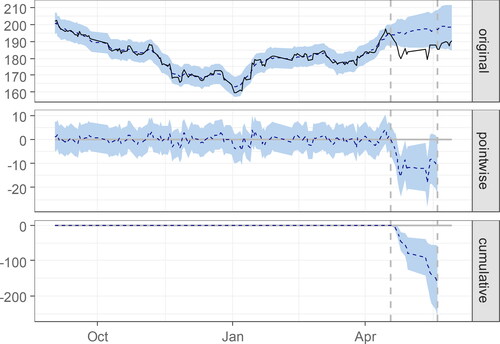
Table 2. Re-selection of covariates.
Figure 7. Replacing the Shanghai index with the Shenzhen index.
Note: The impact of COVID-19 on the Shenzhen index is one the left. The impact of SARS on the Shenzhen index is on the right.
Source: Authors' calculations.
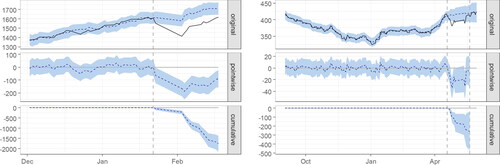
Figure 8. Re-selection of covariates to check the robustness.
Note: On the left is the impact of COVID-19 on the Shanghai index. On the right is the impact of SARS on the Shanghai index.
Source: Authors' calculations.
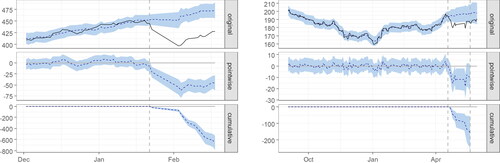
Figure 9. Using one-lagged-period covariates.
Note: The impact of COVID-19 on the Shanghai index is shown on the left. The impact of SARS on the Shanghai index is shown on the right.
Source: Authors' calculations.
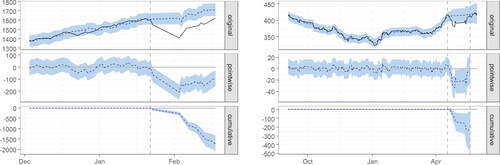
Figure 10. Extending the sample date to February 28, 2020.
Note: (a) In the time series of the Shanghai index, the dotted line is the counterfactual forecast value, (b) pointwise (daily) incremental impact of COVID-19 and (c) cumulative impact of COVID-19.
Source: Authors' calculations.