
Figures & data
Figure 1. Hourly prices of oil, gold, and Bitcoin.
Source: Authors' calculations.
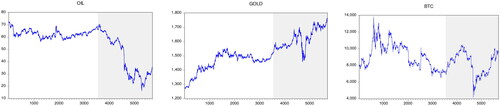
Figure 2. Hourly returns of oil, gold, and Bitcoin.
Source: Authors' calculations.
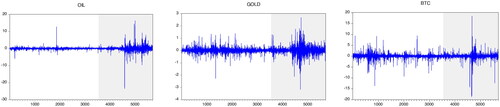
Table 1. Descriptive statistics.
Table 2. Correlation matrix.
Table 3. Return and volatility spill-overs for the pair oil-gold in the pre-COVID-19 period (May 21, 2019 to December 31, 2019).
Table 4. Return and volatility spill-overs for the pair oil-gold during the COVID-19 period (January 1, 2020 to May 20, 2020).
Table 5. Return and volatility linkages for the pair oil-BTC during the pre-COVID-19 period (May 21, 2019 to December 31, 2019).
Table 6. Return and volatility linkages for the pair oil-BTC during the COVID-19 period (January 1, 2020 to May 20, 2020).
Figure 3. Pairwise dynamic conditional correlations.
Source: Authors' calculations.
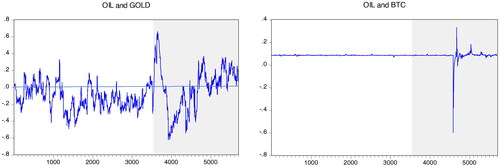
Table 7. Optimal weights and hedge ratios.
Figure 4. Time-varying hedge ratio.
Source: Authors' calculations.
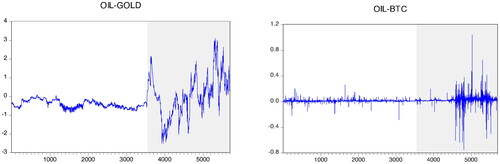
Table 8. Hedging effectiveness (HE) results.
Table 9. Estimation results for the hedge and safe haven properties of gold and Bitcoin against oil during the COVID-19 period.