3,836
Views
13
CrossRef citations to date
0
Altmetric
Articles

Oil market volatility: comparison of COVID-19 crisis with the SARS outbreak of 2002 and the global financial crisis of 2008

&
Pages 1935-1949 | Received 31 Mar 2021, Accepted 05 May 2021, Published online: 01 Jun 2021

Figures & data

Table 1. Descriptive statistics of daily oil returns.

Table 2. Descriptive statistics of daily oil price spread.

Figure 1. Daily oil returns and daily oil price spread during SARS, GFC and COVID-19.

Source: Author's computation.

Figure 1. Daily oil returns and daily oil price spread during SARS, GFC and COVID-19.Source: Author's computation.

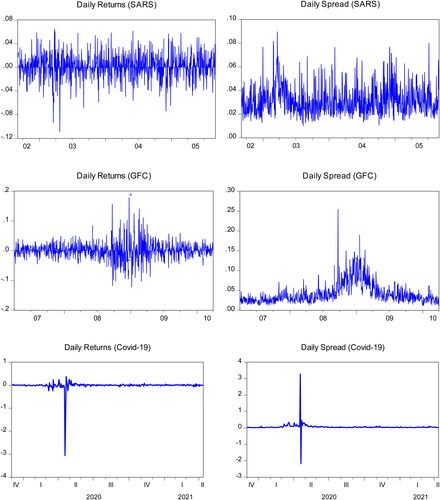
Table 3. Results of symmetric GARCH (1,1).

Figure 2. Conditional standard deviations in oil returns during SARS, GFC and COVID-19 Crises.

Source: Author's computation.

Figure 2. Conditional standard deviations in oil returns during SARS, GFC and COVID-19 Crises.Source: Author's computation.

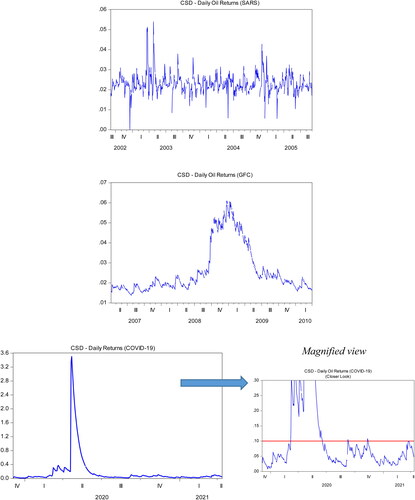
Table 4. Results of Asymmetric GARCH (1,1) [GJR-GARCH].