
Figures & data
Table 1. Prior Studies on the Effect of eWOM.
Figure 1. The effect of eWOM on movie sales and movie screenings in multi-lag terms.
Source: Author's computation.
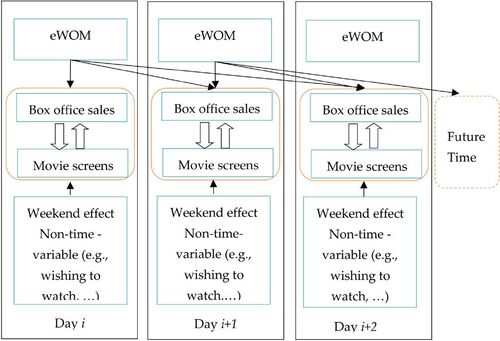
Figure 2. Difference between the Number of Rating and Reviews.
Source: Maoyan Entertainment (http://piaofang.maoyan.com).
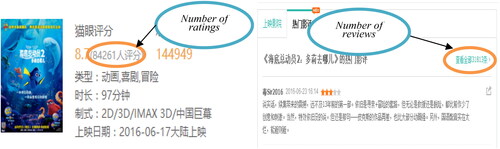
Table 2. Description and Measurement of Key Variables.
Table 3. Summary statistics of the data.
Table 4. Key Variables Correlation Matrix of Data.
Figure 3. Fitting of Daily Revenues. (a) Opening week; (b) Subsequent days.
Source: Author's computation.
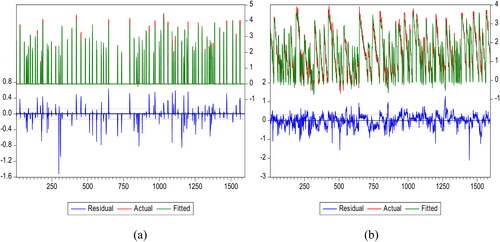
Figure 4. Fitting of Daily Screens. (a) Opening week; (b) Subsequent days.
Source: Author's computation.
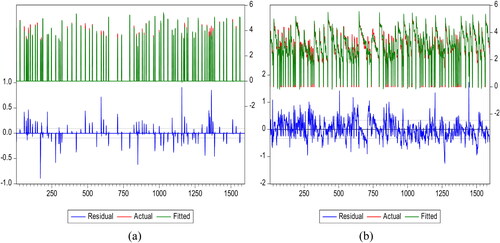
Table 5. SLS Results (Log (Daily Revenues)it as the Dependent Variable).
Table 6. SLS Results (Log (Daily Screens)it as the Dependent Variable).