
Figures & data
Table 1. Descriptive statistics.
Table 2. ADF test results.
Table 3. Granger causality test results.
Table 4. VAR analysis results.
Figure 1. Response of carbon futures return to the shock from investor attention.
Source: the Authors.
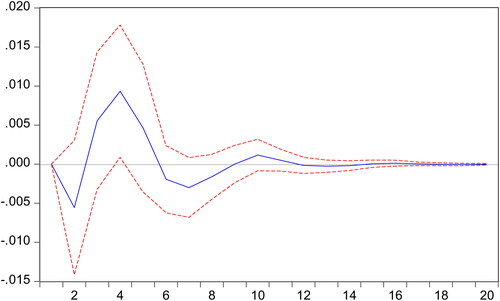
Figure 2. Response of investor attention to the shock from carbon futures return.
Note: In the above figures, the blue solid-line is the impulse response to Cholesky one standard deviation innovations, while the red dotted-line is ninety-five percent confidence interval for highest probability density. And the X-axis represents the duration of shock, while the Y-axis represents the magnitude of such shock.
Source: the Authors.
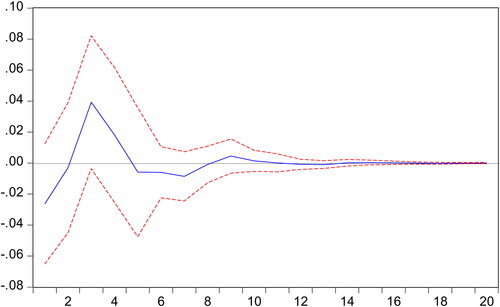
Table 5. Tests for VAR model.
Table 6. The effects of high order moment.
Table 7. The joint impact results.
Table 8. Out-of-sample prediction results with forecast horizon equal to one.
Table 9. Out-of-sample prediction results with different forecast horizons.
Table 10. Portfolio performance measures.
Table 11. Granger causality and VAR analyses for robustness checks.