
Figures & data
Figure 1. Country-wise COVID-19 cases, deaths, and recovered patients.
Source: Author Estimation.
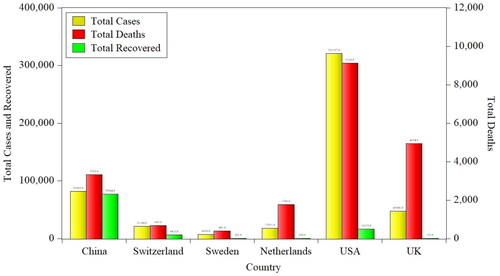
Figure 2. Market capitalization of China and the most advanced countries stock markets US$Billion.
Source: Author Estimation.
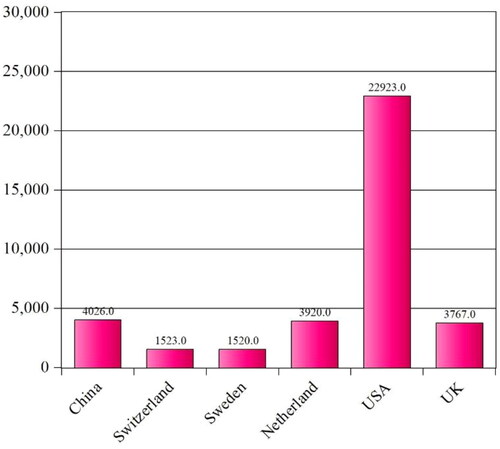
Figure 3. Stock returns of China and the most advanced countries stock markets indices (2015–2020).
Source: Author Estimation.
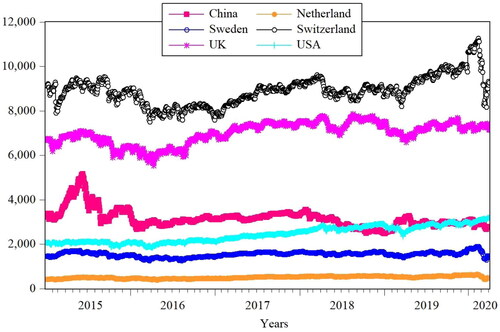
Figure 4. Stock returns of China and the sample countries stock markets indices COVID-19 effect.
Source: Author Estimation.
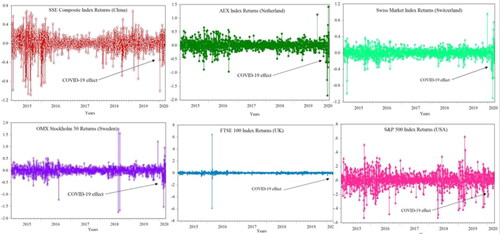
Table 1. Descriptive statistics of the full sample (05 January 2015 to 04 April 2020).
Table 2. Descriptive statistics of the sample before COVID-19 (05 January 2015 to 29 November 2019).
Table 3. Descriptive statistics of the sample during COVID-19 (02 December 2019 to 03 April 2020).
Table 4. Correlation matrix of the full sample (05 January 2015 to 04 April 2020).
Table 5. Correlation matrix of the sample before COVID-19 (05 January 2015 to 29 November 2019).
Table 6. Correlation matrix of the sample during COVID-19 (02 December 2019 to 03 April 2020).
Figure 5. Residuals plot for testing the volatility clustering.
Source: Author Estimation.
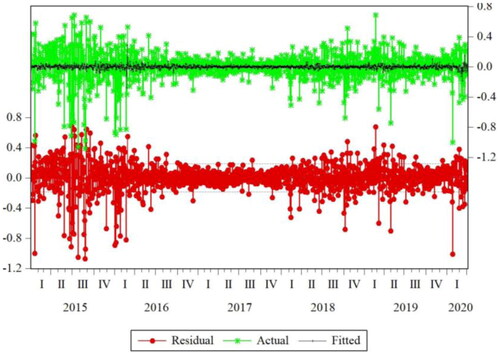
Table 7. ARCH test for the testing ARCH effect.
Table 8. Results of the GARCH model.
Table 9. Results of the EGARCH model.
Table 10. Results of the TARCH model.
Table 11. TARCH results of model 1 full sample (05 January 2015 to 04 April 2020).
Table 12. TARCH results of model 1 before COVID-19 (05 January 2015 to 29 November 2019).
Table 13. TARCH results of model 1 during COVID-19 (02 December 2019 to 03 April 2020).
Table 14. TARCH results of model 2 full sample (05 January 2015 to 04 April 2020).
Table 15. TARCH results of model 2 before COVID-19 (05 January 2015 to 29 November 2019).
Table 16. TARCH results of model 2 during COVID-19 (02 December 2019 to 03 April 2020).
Table 17. TARCH results of model 3 full sample (05 January 2015 to 04 April 2020).
Table 18. TARCH results of model 3 before COVID-19 (05 January 2015 to 29 November 2019).
Table 19. TARCH results of model 3 during COVID-19 (02 December 2019 to 03 April 2020).
Table 20. TARCH results of model 4 full sample (05 January 2015 to 04 April 2020).
Table 21. TARCH results of model 4 before COVID-19 (05 January 2015 to 29 November 2019).
Table 22. TARCH results of model 4 during COVID-19 (02 December 2019 to 03 April 2020).
Table 23. TARCH results of model 5 full sample (05 January 2015 to 04 April 2020).
Table 24. TARCH results of model 5 before COVID-19 (05 January 2015 to 29 November 2019).
Table 25. TARCH results of model 5 during COVID-19 (02 December 2019 to 03 April 2020).
Table 27. TARCH results of model 6 full sample (05 January 2015 to 04 April 2020).
Table 28. TARCH results of model 6 before COVID-19 (05 January 2015 to 29 November 2019).
Table 29. TARCH results of model 6 during COVID-19 (02 December 2019 to 03 April 2020).