
Figures & data
Figure 1. Logistic Performance Index 2018.
Source: World Bank (2018).
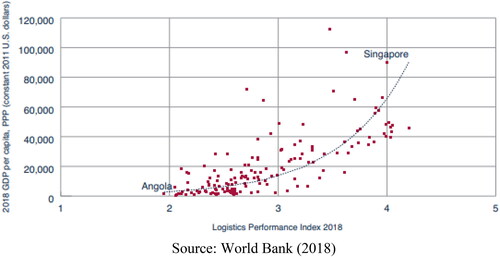
Figure 2. Conceptual model of the study.
Source: Author Estimation.
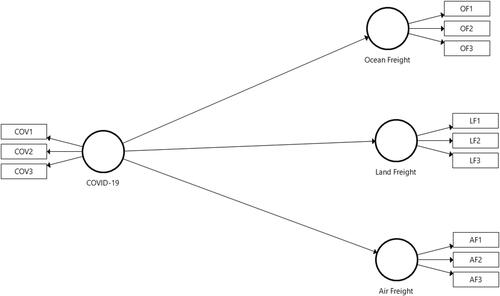
Figure 3. Measurement model.
Source: Author Estimation.
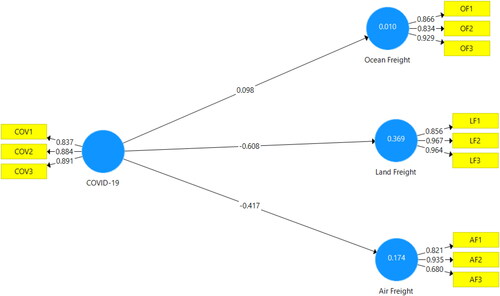
Table 1. Reliability and convergent validity of the constructs.
Table 2. Determination of discriminant validity using HTMT ratio.
Figure 4. Bootstrapping with T-statistics.
Source: Author Estimation.

Table 3. Path analysis.
Figure 5. Blindfolding.
Source: Author Estimation.
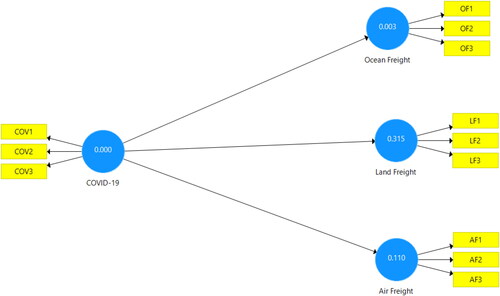
Table 4. R-squared and blindfolding (Q-square).