
Figures & data
Figure 1. Top authors’ production over the time (1995-2019).
Source: Authors’ own research.
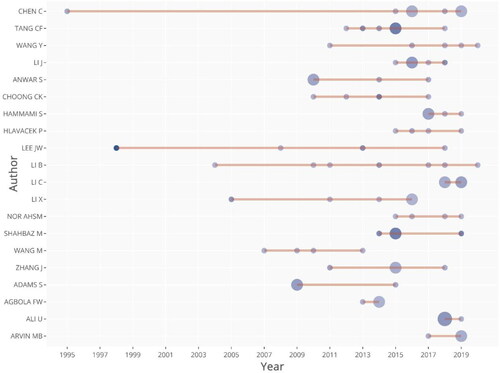
Figure 2. Conceptual structure map.
Source: Authors’ own research.
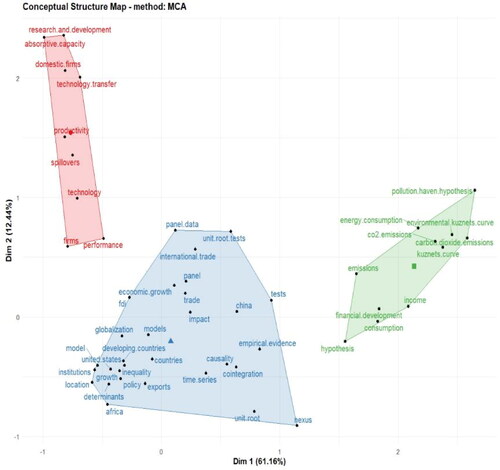
Figure 3. Topic dendrogram of hierarchical cluster analysis of keywords plus in the field of FDI-EG.
Source: Authors’ own research.
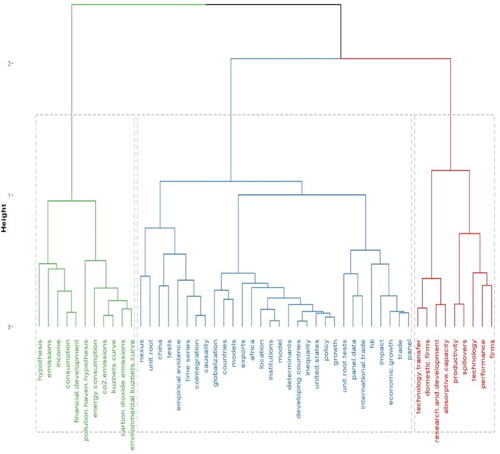
Figure 4. Factorial map of the documents with the highest contributions.
Source: Authors’ own research.
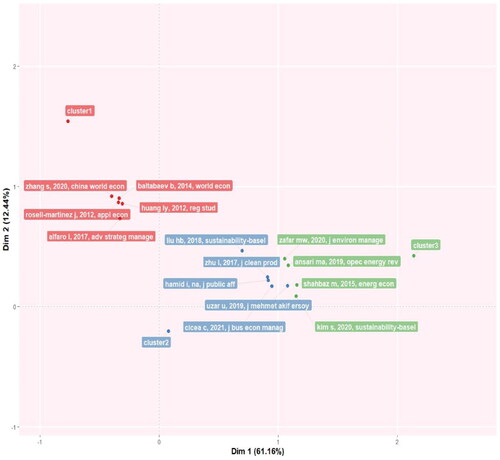
Figure 5. Strategic diagrams of FDI-EG research (1992-2021).
Source: Authors’ own research.
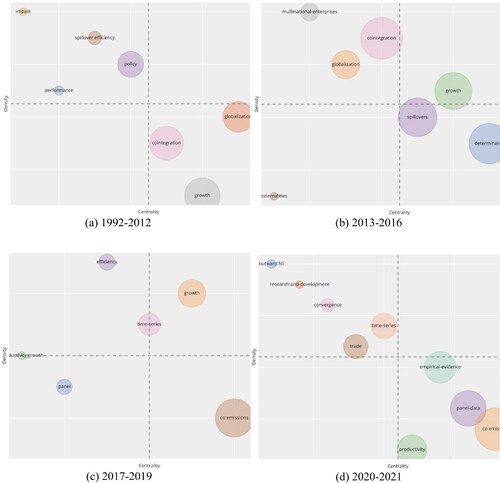
Figure 6. Thematic evolution of FDI-EG research (1992-2021).
Source: Authors’ own research.
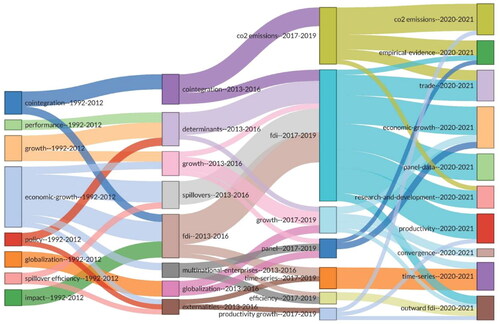
Table 1. The nature of the FDI-EG relationship identified in the relevant literature.
Table 2. The factors for the FDI-EG relationship identified in the relevant literature.
Table 3. The FDI-EG research in different fields of activity identified in the relevant literature.
Table 4. The top 10 highly total cited documents related to the FDI-EG relationship.
Table 5. The top 10 highly average cited documents related to the FDI-EG relationship.
Table 6. The top 10 countries/regions of publications in co-authorship analysis.
Table 7. The top 10 highly cited sources of documents in citation analysis.
Table 8. The top 10 highly cited sources of documents in co-citation analysis.
Table 9. Advantages and drawbacks of bibliometric and review measurement approaches.