Figures & data
Figure 1. The actual inflation and firms’ inflation expectations in the United States. Source: Authors’ calculation.
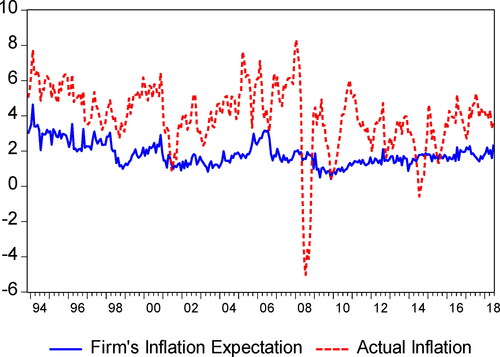
Table 1. Stationarity tests for inflation expectations and actual inflation.
Table 2. Maximum likelihood estimates for households and firms with the naïve expectation, adaptive expectation, and VAR model.
Figure 2. The proportions of the Naïve Expectation, Adaptive Expectation, and VAR model for households (January 1978 to June 2018). Source: Authors’ calculation.
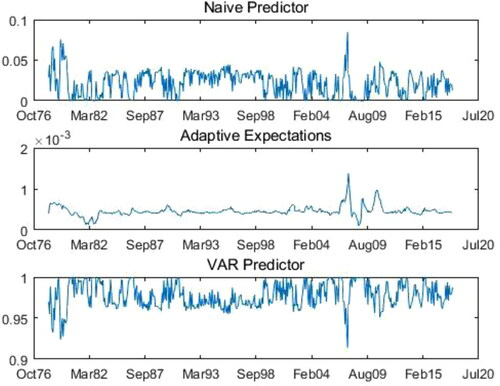
Figure 3. The proportions of the Naïve Expectation, Adaptive Expectation, and VAR model for households (November 1993 to June 2018). Source: Authors’ calculation.
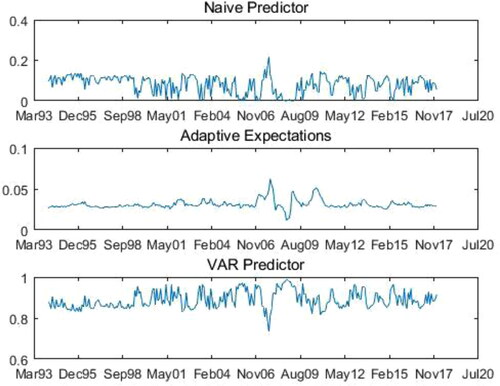
Figure 4. The proportions of the Naïve Expectation, Adaptive Expectation, and VAR model for firms (November 1993 to June 2018). Source: Authors’ calculation.
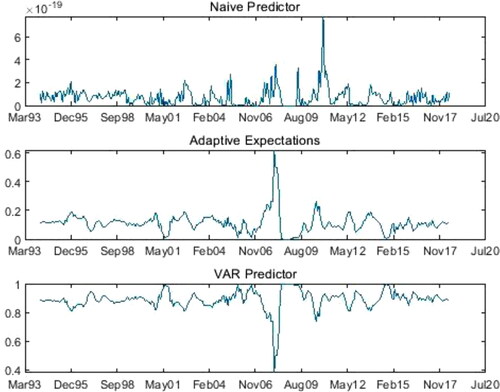
Table 3. Maximum likelihood estimates for households and firms with alternative predictor sets.
Figure 5. The proportions of the Adaptive Expectation, VAR model, and the Rational Expectation for firms (November 1993 to June 2018). Source: Authors’ calculation.
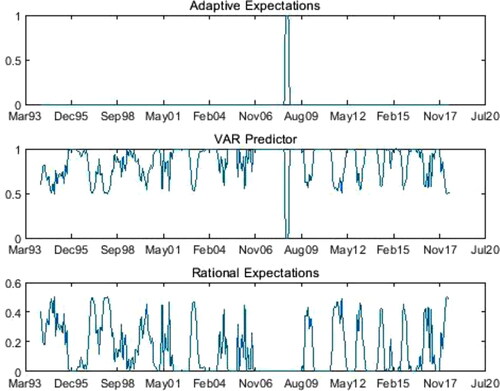
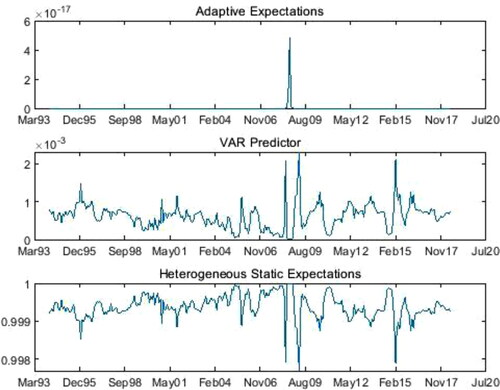
Figure 6. The proportions of the Adaptive Expectation, VAR model, and the Heterogeneous Static Expectation for firms (November 1993 to June 2018). Source: Authors’ calculation.