
Figures & data
Figure 1. Time series plot of Exchange rates of China and the USA.
Source: Authors Estimation.
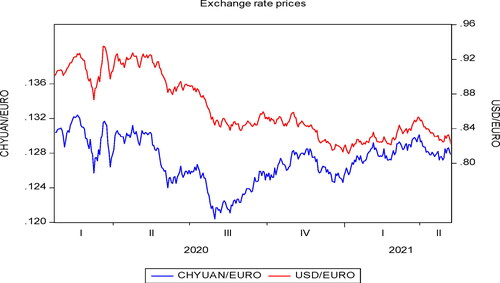
Figure 2. Time series plot of the number of cases and deaths reported in China and the USA.
Source: Authors Estimation.
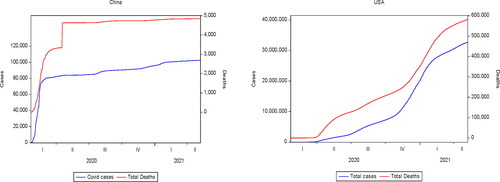
Table 1. Summary statistics of variables under study.
Table 2. Outcomes of the unit root test with and without structural break.
Table 3. Estimation results of ARDL Bound test of cointegration.
Figure 3. CUSUM stability test of China and the USA for COVID-19 cases.
Source: Authors Estimation.
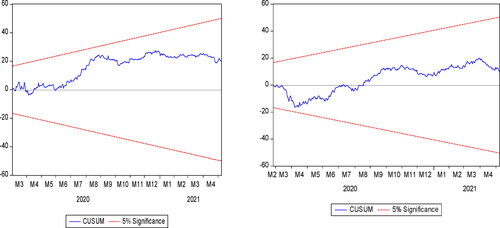
Figure 4. CUSUM stability test of China and the USA for COVID-19 Deaths.
Source: Authors Estimation.
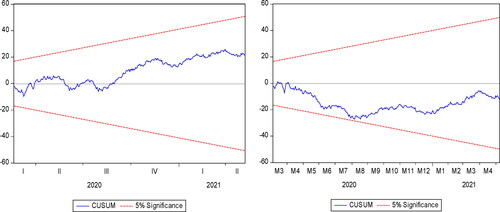
Table 4. Estimation results of ARDL long (short) run estimates with COVID-19 cases.
Table 5. Estimation results of ARDL long (short) run estimates with COVID-19 deaths.