
Figures & data
Figure 1. Comparison of store G’s profits between the specialisation and expansion strategies (c = 0.5, α = 0.5). A: B:
C: Non-feasible areas, Dashed line:
Source: Authors.
![Figure 1. Comparison of store G’s profits between the specialisation and expansion strategies (c = 0.5, α = 0.5). A: ΠG1*−ΠG2*>0, B: ΠG1*−ΠG2*<0, C: Non-feasible areas, Dashed line: DS=[c(1+α)].Source: Authors.](/cms/asset/673a23df-30df-44e4-9c48-296a2c5166e4/rero_a_1962384_f0001_b.jpg)
Figure 2. Store G’s profits for different levels of service (c = 0.5, α = 0.5). Dashed line = Straight line =
Source: Authors.
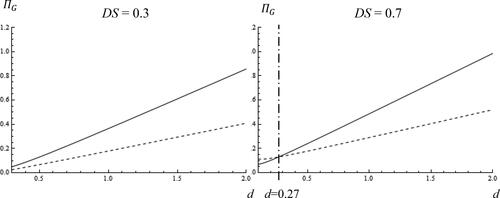
Table 1. Examination of [DS/d*] for different parameter values.
Figure 3. Store G’s profits for different α values (c = 0.5, DS = 0.7).
Source: Authors.
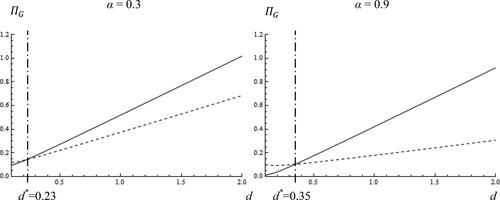
Figure 4. Store G’s profits for different values of c and α. A: B:
C: Non-feasible areas, Dashed line:
Source: Authors.
![Figure 4. Store G’s profits for different values of c and α. A: ΠG1*−ΠG2*>0, B: ΠG1*−ΠG2*<0, C: Non-feasible areas, Dashed line: DS=[c(1+α)].Source: Authors.](/cms/asset/85aa0184-9875-4ea6-abc3-2f871d5c6a76/rero_a_1962384_f0004_b.jpg)