
Figures & data
Table 1. Variable definitions.
Figure 1. Sample of evolution of M&A transactions during 2008–2018.
Source: Authors formation.
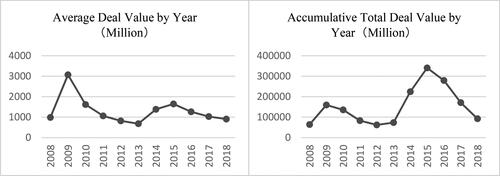
Table 2. Summary statistics.
Table 3. Univariate test of differences between SOE and non-SOE acquirers.
Table 4. Regression of overseas M&A experience on positive coverage.
Table 5. Regression of overseas M&A experience on media attention.
Table 6. Interaction effect of deal size and overseas experience on positive coverage.
Table 7. Interaction effect of deal size and overseas experience on media attention.
Table 8. Comparison between state-controlled media and market-oriented Media.
Table 9. PSM estimation.