
Figures & data
Figure 1. The daily indexes.
Source: statistical software EViews.
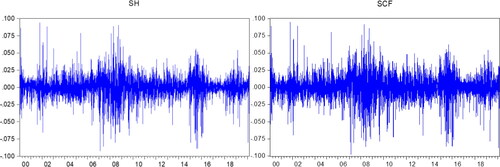
Figure 2. Descriptive statistics of index returns.
Source: statistical software EViews.
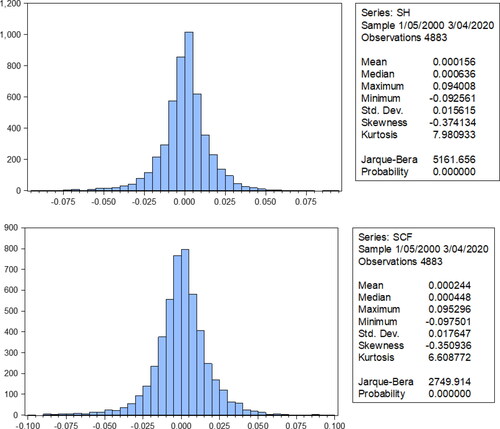
Table 1. Descriptive statistics.
Figure 3. Q-Q plots of return series.
Source: statistical software EViews.
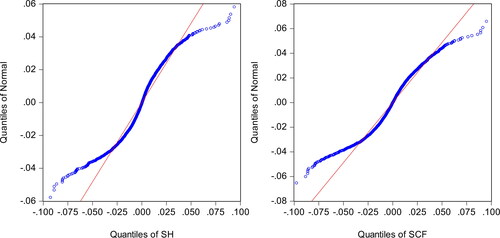
Table 9. Summary statistics in SCF.
Table 2. ADF test results.
Table 3. The autocorrelation test results in SH.
Table 10. Estimation for ARMA (4,4)-GARCH (1,1) in SH.
Table 11. Estimation for ARMA (1,1)-GARCH (1,1) in SCF.
Table 4. The autocorrelation test results in SCF.
Table 5. ARMA model estimation results of SH and SCF return series.
Table 13. Estimation for PARCH (1,1) in SH.
Table 14. Estimation for PARCH (1,1) in SCF.
Table 8. Summary statistics in SH.
Table 15. Results of the ARCH-LM test for the PARCH model.
Table 16. Estimation results of CARCH (1,1) for SH.
Table 17. Estimation results of CARCH (1,1) for SCF.
Table 18. Results of the ARCH-LM test for the CARCH model.
Table 19. Estimation results of TGARCH (1,1) for SH.
Table 20. Estimation results of TGARCH (1,1) for SCF.
Table 21. Results of the ARCH-LM test for the TGARCH model.
Table 22. Estimates of EGARCH (1,1) for SH.
Table 23. Estimates of EGARCH (1,1) for SCF.
Table 24. Results of the ARCH-LM test for the EGARCH model.
Table 25. Forecast values of the SH series.
Table 26. Forecast values of the SCF series.
Table 27. Loss function values of the forecasting of SH return series.
Table 28. Loss function values of the forecasting of SCF return series.
Table 6. The autocorrelation test results of SH’s squared residual.
Table 7. The autocorrelation test results of SCF’s squared residual.
Table 12. Results of ARCH-LM test.