Figures & data
Table 1. Air quality grade corresponding to the PM2.5 index.
Table 2. PM2.5 urban agglomerations.
Figure 1. Left: Annual average PM2.5 kernel density of Chinese cities from 1998 to 2013. Right: Annual average PM2.5 kernel density of Chinese cities from 2015 to 2019. Note: 1998–2013 average PM2.5 concentration data source: Columbia University project (van Donkelaar et al., Citation2016).
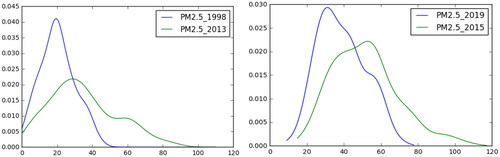
Table 3. The transition probability matrix of PM2.5 in Chinese cities from 2015 to 2019.
Figure 2. Left: 2015–2019 PM2.5 transition probability density three-dimensional diagram. Right: 2015–2019 PM2.5 transition probability density two-dimensional contour.
Source: Organized by the authors.
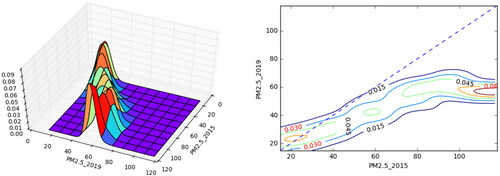
Figure 3. Left: The ergodic distribution in 1998–2013 and 2015–2019. Right: The actual distribution in 2019 and the ergodic distribution in 2015–2019.
Source: Organized by the authors.
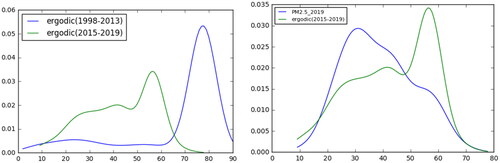
Figure 4. The distribution of average PM2.5 in winter in Chinese cities from 2015 to 2018.
Source: Organized by the authors.
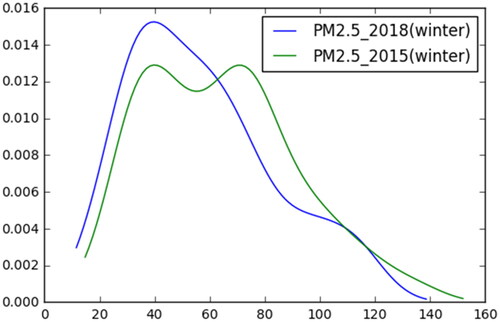
Table 4. The transition probability matrix of winter PM2.5 in Chinese cities from 2015 to 2018.
Figure 5. Three-dimensional diagram of the transition probability and the corresponding two-dimensional contour.
Source: Organized by the authors.
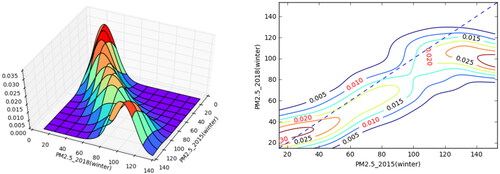
Figure 6. The ergodic distribution of PM2.5 in winter 2015–2018 and the actual distribution of PM2.5 in the winter of 2015.
Source: Organized by the authors.
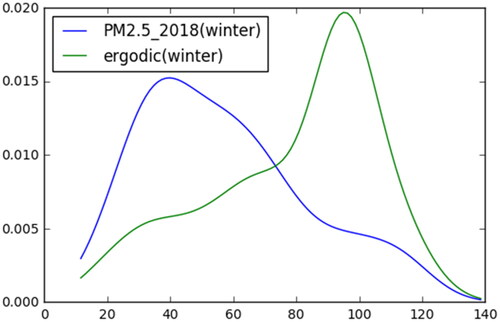
Figure 7. Three regions of China.
Note: Described in section 2.2.2.
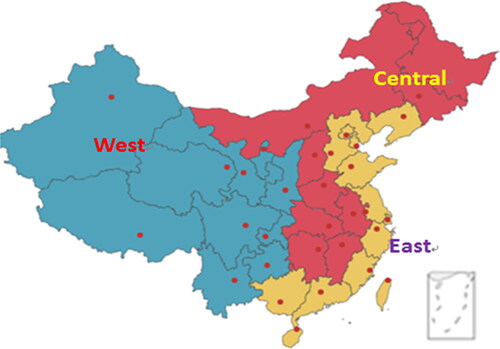
Table 5. The transition probability matrix of annual PM2.5 of cities in eastern, central, and western regions from 2015 to 2019.
Table 6. The transition probability matrix of winter PM2.5 of cities in eastern, central, and western regions from 2015 to 2018.
Figure 8. The annual average PM2.5 ergodic distribution of cities in three regions from 2015 to 2019.
Source: Organized by the authors.
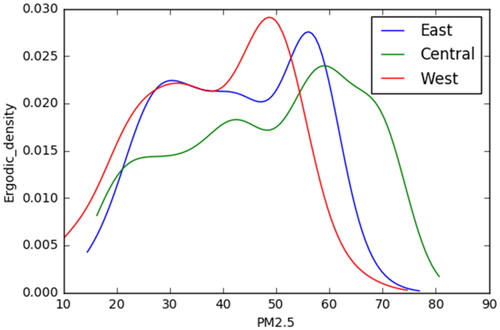
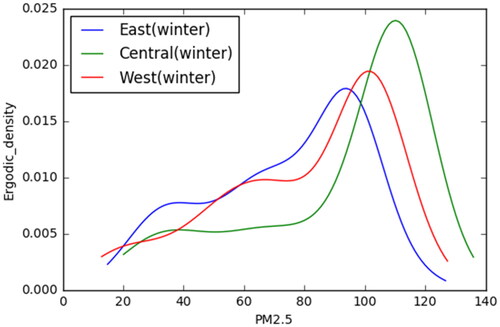
Figure 9. The ergodic distribution of winter PM2.5 of cities in three regions from 2015 to 2018.
Source: Organized by the authors.