Figures & data
Figure 1. The number of published papers per year of portfolio optimization research.
Source: Web of Science.
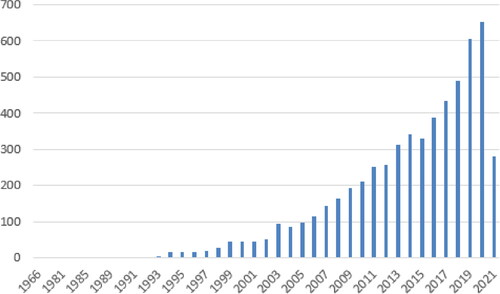
Figure 2. The document types of portfolio optimization research.
Source: Web of Science.
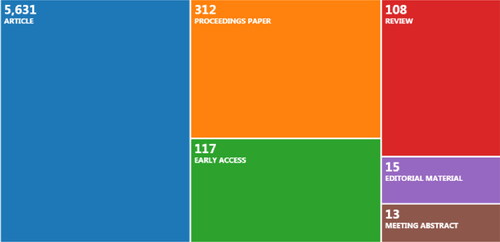
Table 2. The top 10 research areas of portfolio optimization research.
Table 1. The top 10 WoS categories of portfolio optimization research.
Figure 3. The author's collaboration of portfolio optimization research.
Source: Citespace.
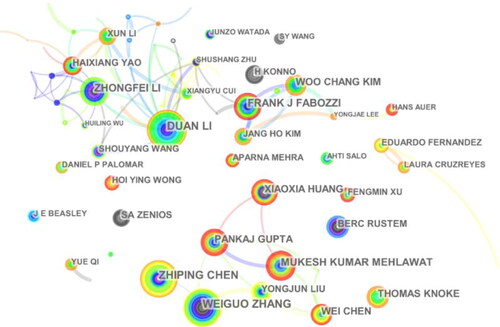
Table 3. Top 20 productive authors of portfolio optimization research.
Figure 4. The institution collaboration of portfolio optimization research.
Source: Citespace.
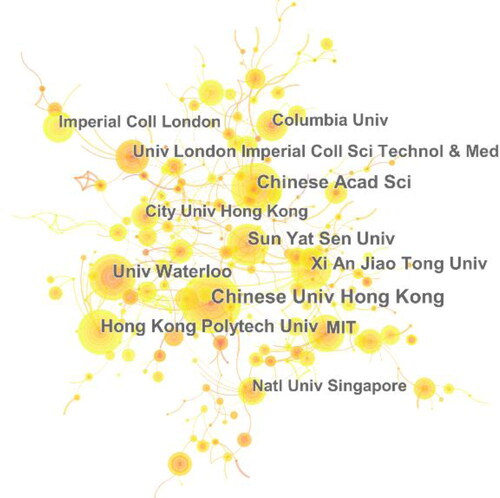
Table 4. Top 10 productive institutions of portfolio optimization research.
Table 5. Top 10 productive countries/territories of portfolio optimization research.
Figure 5. The country collaboration of portfolio optimization research.
Source: Citespace.
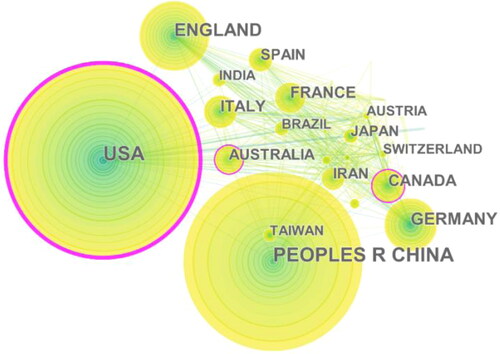
Figure 6. The cluster network of portfolio optimization research.
Source: Citespace.
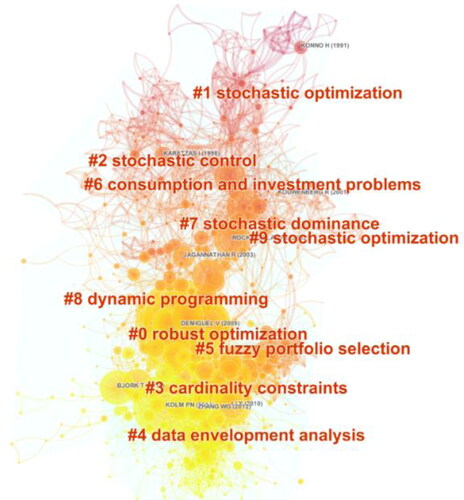
Table 6. The largest 10 clusters of portfolio optimization research.
Table 7. Top 15 cited references for portfolio optimization research.
Table 8. Top 20 cited references with the strongest citation burst.
Table 9. Top 12 keywords with the strongest citation bursts.
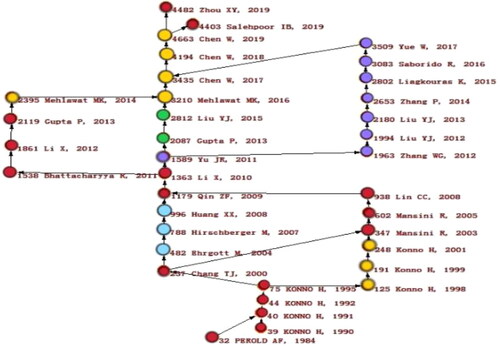
Figure 7. The local forward main path of portfolio optimization research.
Source: Pajek.
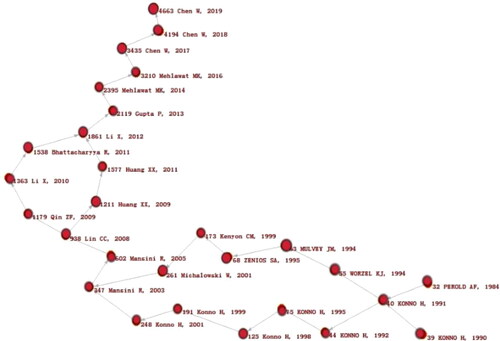
Figure 8. The local backward main path of portfolio optimization research.
Source: Pajek.
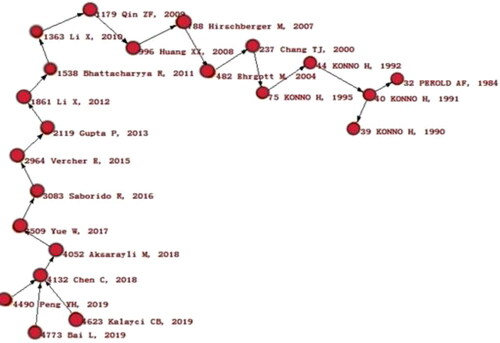
Figure 9. The global standard main path of portfolio optimization research.
Source: Pajek.
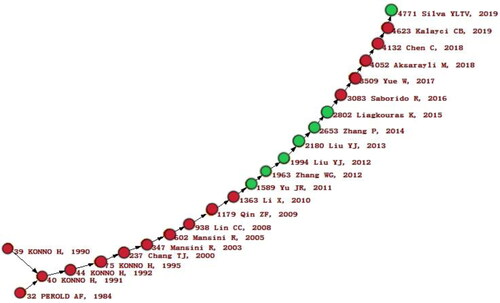
Figure 10. The global key-route main path of portfolio optimization research.
Source: Pajek.