
Figures & data
Figure 1. A two-stage process with shared resource inputs.
Source: Adopted from Chen and Guan (Citation2012).
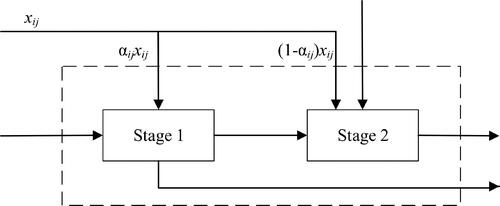
Figure 2. Two-stage process with shared inputs of regional innovative resource allocation.
Source: Author’s own drawing.
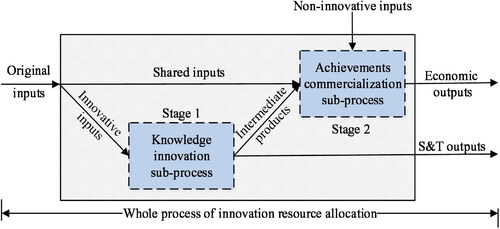
Table 1. Descriptive analysis of evaluation indexes.
Table 2. Efficiency scores of innovation resource allocation.
Figure 3. Trends in the overall and sub-stages efficiency of regional innovation resources.
Source: Author’s own drawing.
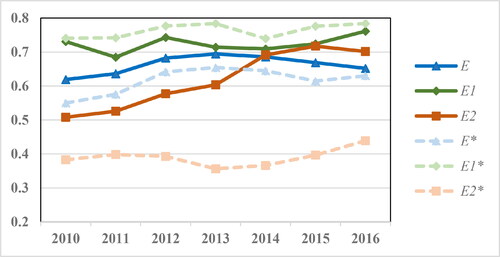
Figure 4. Influencing mechanism of regional innovation resource allocation efficiency.
Source: Author’s own drawing.
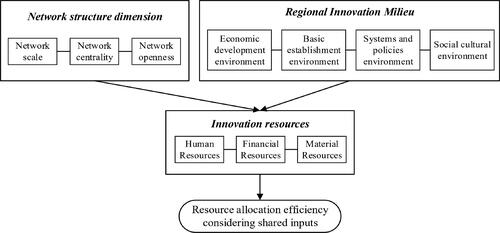
Table 3. Qualitative breakpoints for variables fuzzy calibration.
Table 4. Necessity analysis of conditional variables.
Table 5. Truth table of efficient path for regional innovation resource allocation.
Table 6. Parsimonious and intermediate for efficient allocation of regional innovation resources.
Table 7. Efficient allocation path of regional innovation resources.