
Figures & data
Table 1. Influence factors related to patent value.
Table 2. Patent value distribution of firms, by quantile: 1990-2013.
Figure 1. Trend of the scale of patent value for firms over time.
Source: Authors.
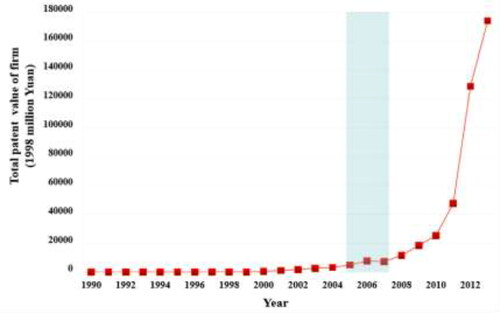
Figure 2. Share of each industry in total patent value of firms (%).
Source: Authors.
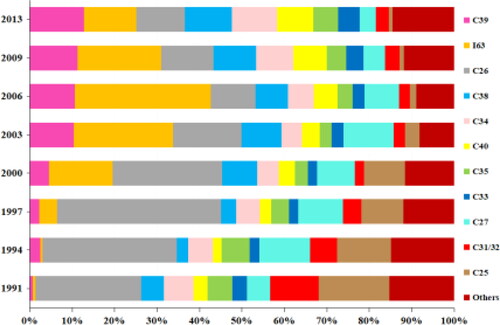
Figure 3. Share of regions in the total patent value of firms (unit: million yuan).
Source: Authors.
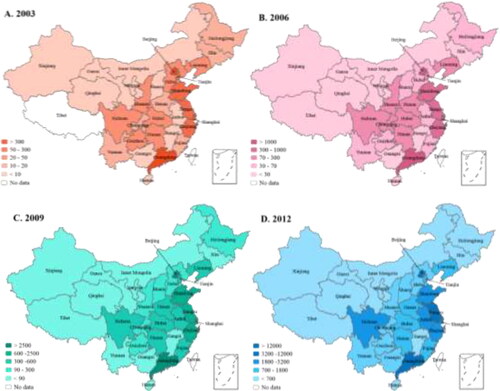
Table 3. Results of DID analysis for the S&T Outline effect.
Figure 4. Placebo test for the DID model. It shows the distribution of ‘wrong’ estimation coefficients after 1000 placebo tests; the vertical dashed line indicates the ‘correct’ estimation coefficients.
Source: Authors.
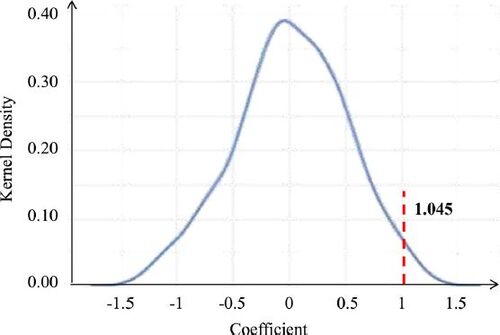
Figure 5. The regional innovation networks from 2001–2005 and 2006–2010. The circle size indicates the scale of patent value.
2001–2005: before the publication of S&T Outline
2006-–2010: after the publication of S&T Outline.
Source: Authors.
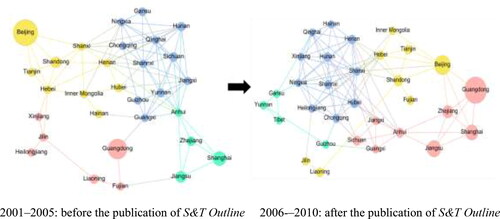
Figure 6. Industrial innovation networks from 2001–2005 and 2006-–2010. The circle size indicates the scale of patent value. The detailed explanation of specific industry codes is presented in Appendix D.
2001–2005: before the publication of S&T Outline
2006–2010: after the publication of S&T Outline.
Source: Authors.
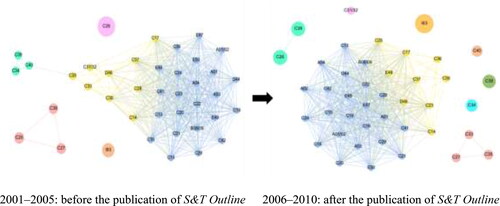
Figure 7. Theil indexes and its decomposition-indexes (within-industry and between-industry) from 1990–2013.
Source: Authors.
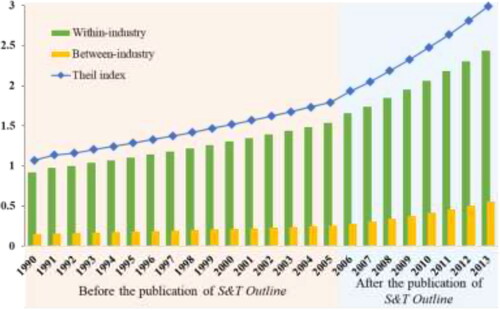
Table A K-S test of patent renewal pattern fitting effects.
Table B1. Trend test of patent renewal distribution’ mean.
Table B2. Trend test of patent renewal distribution’ variance.
Table C. Pearson's correlation coefficient between lifespan and PVD, SOP of patent.
Table D1. Provinces in China.
Table D2. Industrial Sectors in China.