
Figures & data
Figure 1. Chinese HSR network before 2015.
Source: Authors.
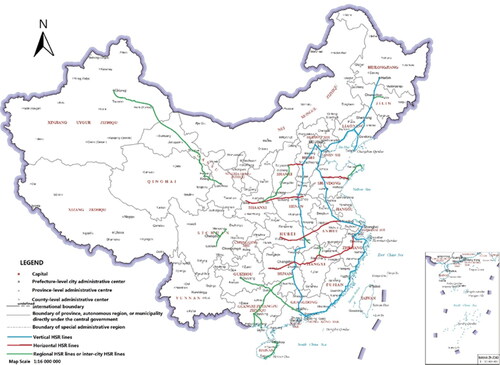
Table 1. Descriptive statistics.
Figure 2. The trend of the average local GDP of cities.
Source: Authors.
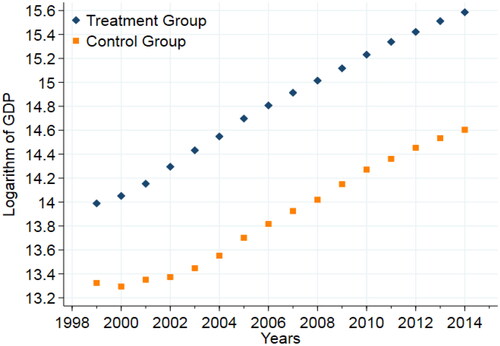
Figure 3. Histograms of average local GDP (1999–2006).
Source: Authors.
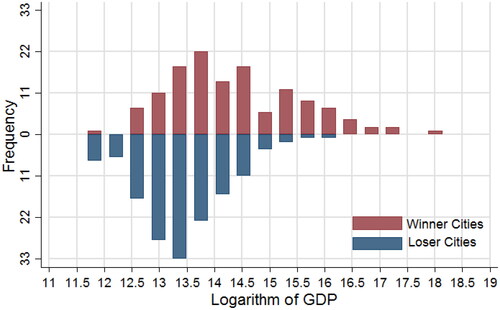
Figure 4. The logarithm of GDP for the treatment group and control group.
Source: Authors.
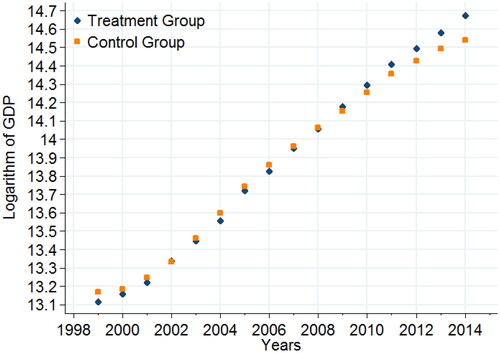
Figure 5. The difference in GDP between the control group and treatment group.
Source: Authors.
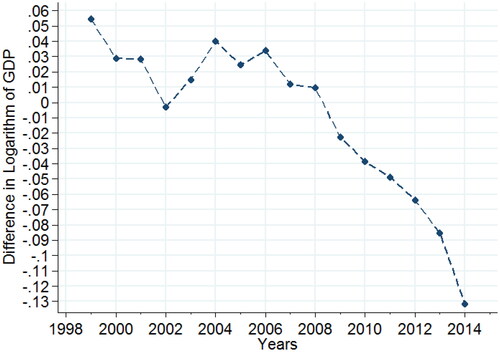
Table 2. DID regressions.
Figure 6. Dynamics of the economic effects of the HSR network.
Source: Authors.
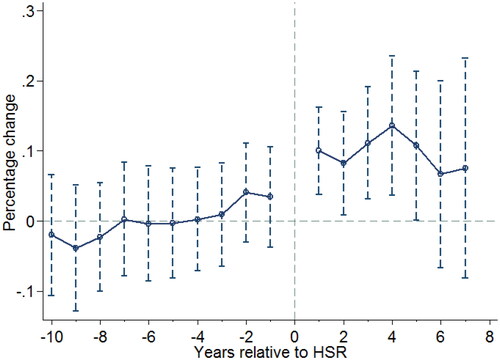
Figure 7. Logarithm of the number of industrial enterprises.
Source: Authors.
Figure 8. Logarithm of gross industrial output.
Source: Authors.
Figure 9. Logarithm of the number of people employed in manufacturing.
Source: Authors.
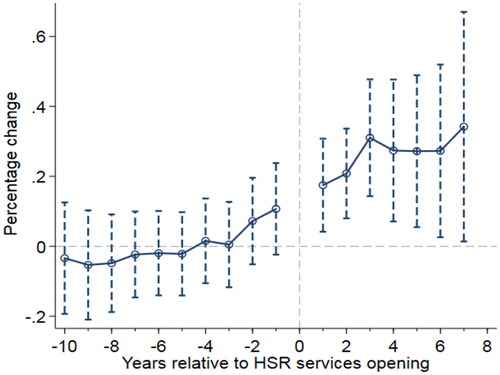
Figure 10. The ratio of industrial output to local GDP.
Source: Authors.
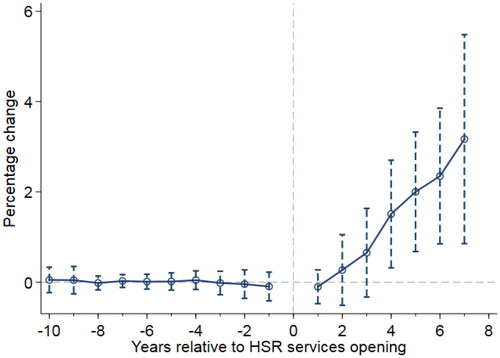
Figure 11. Logarithm of the number of people employed in the service sector.
Source: Authors.
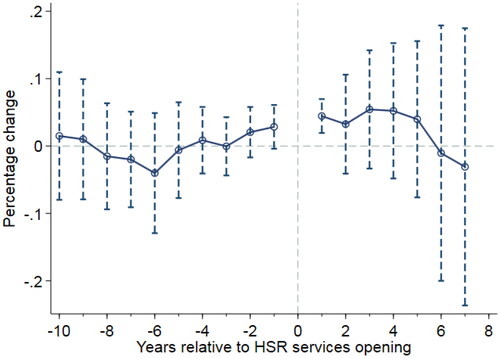
Figure 12. Logarithm of the number of people employed in finance.
Source: Authors.
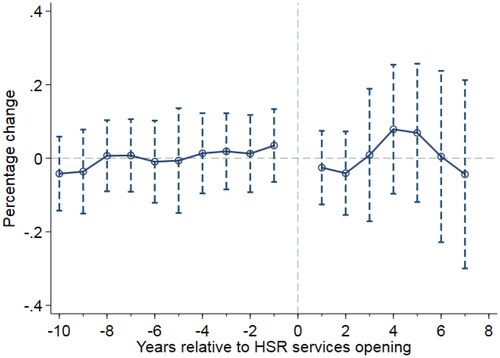
Figure 13. Logarithm of the number of people employed in information transmission, computer services and software.
Source: Authors.
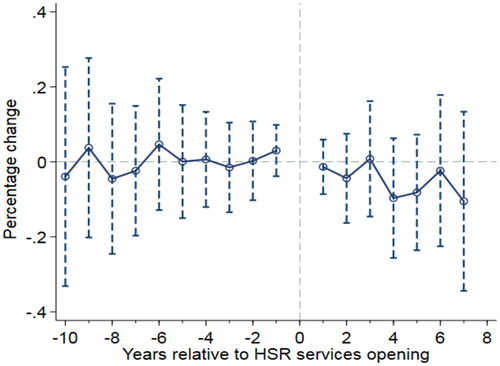
Figure 14. Logarithm of the number of people employed in wholesale and retail trade.
Source: Authors.
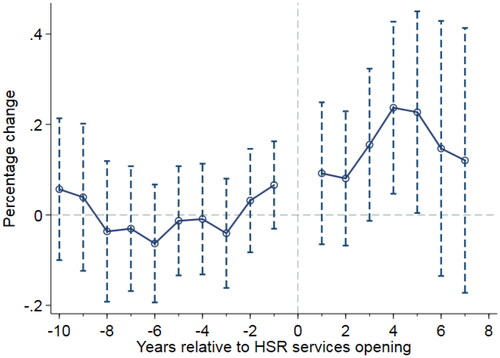
Figure 15. Logarithm of the number of people employed in hotels and catering services.
Source: Authors.
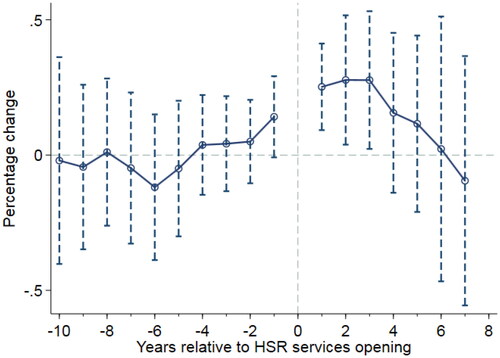
Figure 16. The index of service sector specialization.
Source: Authors.
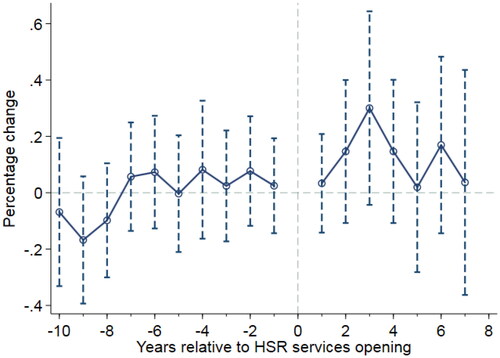
Figure 17. The index of service sector diversification.
Source: Authors.
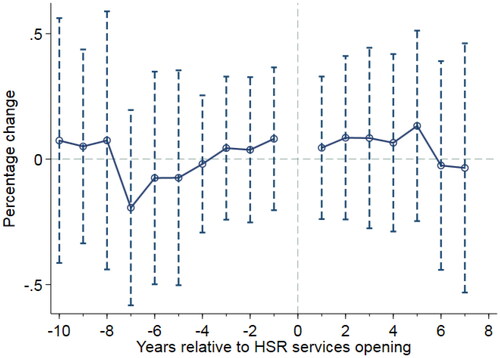
Table 3. IV Regression.
Table 4. PSM-DID Regressions.
Figure 18. Placebo tests.
Source: Authors.
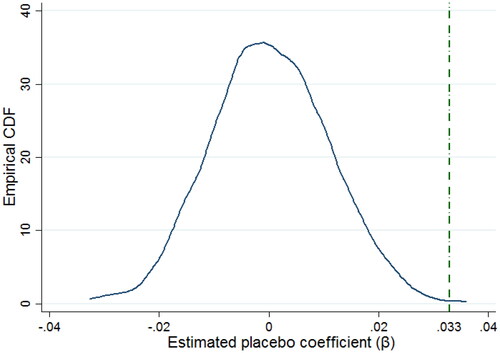
Table 5. Sensitivity tests.