
Figures & data
Figure 1. Variation trend of Jiangsu Province’s financial development indicators from 1985–2016.
Source: Jiangsu Province Bureau of statistics (http://tj.jiangsu.gov.cn/index.html) and the China Banking and Insurance Regulatory Commission. (http://www.cbirc.gov.cn/).
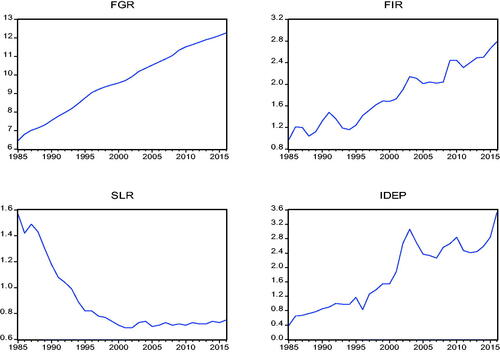
Figure 2. Trend of annual export trade growth rate and export rate structure from 1985–2016.
Source: Jiangsu Province Bureau of statistics (http://tj.jiangsu.gov.cn/index.html) and the China Banking and Insurance Regulatory Commission. (http://www.cbirc.gov.cn/).
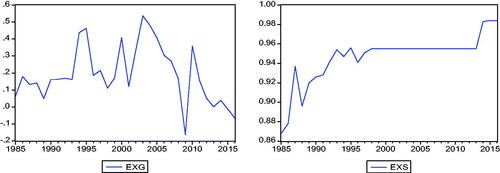
Table 1. Descriptive statistical analysis of each variable of interest.
Table 2. Correlation analysis among the variables of interest.
Table 3. Results of the principal component analysis for SLR, IDEP, and FIR.
Table 4. Augmented Dickey–Fuller unit root test results.
Table 5. Results of the Granger test for export trade growth rate and independent variables.
Table 6. Results of the Granger test for export trade structure and independent variables.
Table 7. Regression results for the influence of financial development on the export trade of Jiangsu Province.
Table 8. Regression results of the effect of financial development on the export trade structure of Jiangsu Province.