
Figures & data
Figure 1. The structure of the vine grouped model.
Source: Authors.
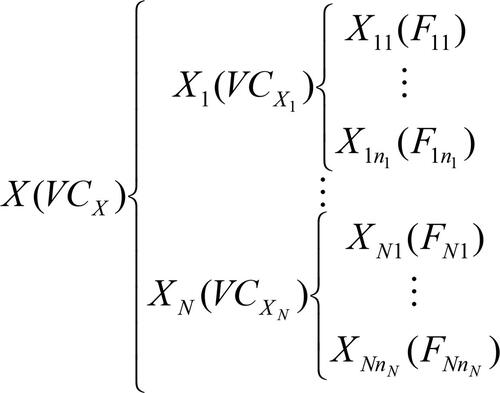
Table 1. Names and industry classifications of Chinese financial institutions.
Table 2. Descriptive statistics and correlations matrix for returns of Chinese financial industries.
Table 4. Estimates for the copula models for the Chinese financial industries and the financial system.
Table 3. The distributions of the residuals and parameter estimates for the marginal distribution models.
Figure 2. Time series plots of VaR and CoVaR for the three financial industries.
Source: Authors.
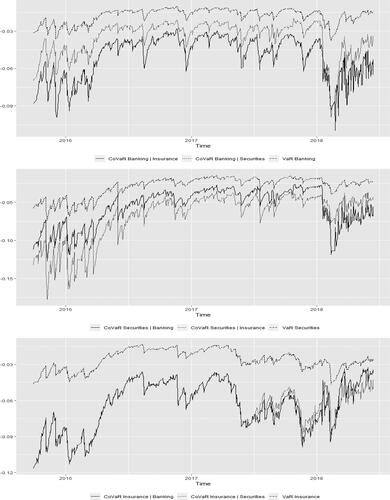
Table 5. VaR, CoVaR and CoVaR for the three financial industries with the vine copula grouped model.
Table 6. The CoVaR and the CoVaR for the three financial industries and the financial system based on the vine copula grouped model and the vine copula model.
Table 7. Test statistics and p values for CoVaR unconditional coverage test with the vine copula grouped model and the vine copula model.